Page 317 - Improving Machinery Reliability
P. 317

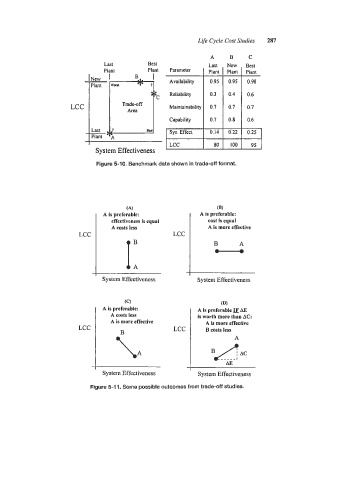
Life Cycle Cost Studies   287

                                                                          C
                                Last         Best              Last   New   Best
                                PI  It       Plant   Parameter   Plant   Plant   Plant
                                              I
                                                   Availability   0.95   0.95   0.98
                                                   Reliability   0.3   0.4   0.6
                                     Tradeoff
                                                   Maintainability   0.7   0.7   0.7
                                                   Capability   0.7   0.8   0.6
                                                   Sys. Effect.   0.14   0.22
                                  A
                                                                80   loo
                             System Effectiveness

                              Figure 5-10. Benchmark data shown in trade-off format.


                                      (A)                        (B)
                                A is preferable:            A is preferable:
                                  effectiveness is equal      cost is equal
                                  A costs less                A is more effective
                        LCC                         LCC
                                      I1                        B       A
                                                                 n


                                                        -
                               System Effectiveness        System Effectiveness


                                      (C)                         (D)
                               A is preferable:            A is preferable   AE
                                  A costs less             is worth more than AC:
                                  A is more effective         A is more effective
                        LCC                         LCC       B costs less
                                                                      A


                               System Effectiveness         System Effectiveness

                            Figure 5-1 1. Some possible outcomes from trade-off studies.
   312   313   314   315   316   317   318   319   320   321   322