
Page 318 - Improving Machinery Reliability
P. 318
288 Improving Machinery Reliability
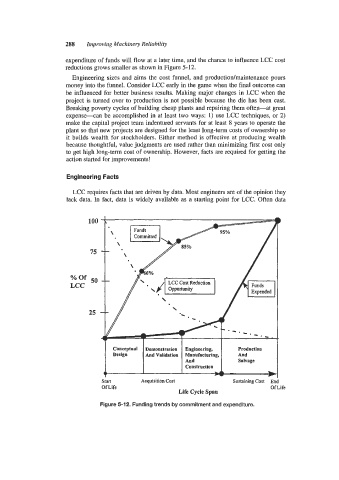
expenditure of funds will flow at a later time, and the chance to influence LCC cost
reductions grows smaller as shown in Figure 5-12.
Engineering sizes and aims the cost funnel, and production/maintenance pours
money into the funnel. Consider LCC early in the game when the final outcome can
be influenced for better business results. Making major changes in LCC when the
project is turned over to production is not possible because the die has been cast.
Breaking poverty cycles of building cheap plants and repairing them often-at great
expense-can be accomplished in at least two ways: 1) use LCC techniques, or 2)
make the capital project team indentured servants for at least 8 years to operate the
plant so that new projects are designed for the least long-term costs of ownership so
it builds wealth for stockholders. Either method is effective at producing wealth
because thoughtful, value judgments are used rather than minimizing first cost only
to get high long-term cost of ownership, However, facts are required for getting the
action started for improvements!
Engineering Facts
LCC requires facts that are driven by data. Most engineers are of the opinion they
lack data. In fact, data is widely available as a starting point for LCC. Often data
100 B
75
%Of 50
LCC
25
Stan Acquisition Cost Sustaining Cost En I
Of Life 01 Life
Life Cycle Span
Figure 5-12. Funding trends by commitment and expenditure.