
Page 476 - Industrial Power Engineering and Applications Handbook
P. 476
14/450 Industrial Power Engineering and Applications Handbook
rise, t,, is adjusted according to the shape of the RRS. With the recording of the three RRS or two, as the case
The data is acquired at 100 samples per second, enough may be, the table is now actuated in the respective
to meet the requirements of accurate recording of direction, according to the simulated RRS and the response
frequency in earthquake movements. spectra of the history of table acceleration obtained, which
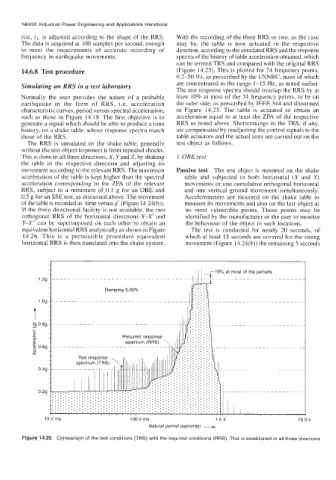
can be termed TRS and compared with the original RRS
14.6.8 Test procedure (Figure 14.25). This is plotted for 74 frequency points,
0.2-50 Hz, as prescribed by the USNRC, most of which
Simulating an RRS in a test laboratory are concentrated in the range 1-15 Hz, as noted earlier.
The test response spectra should overlap the RRS by at
Normally the user provides the nature of a probable least 10% at most of the 74 frequency points, to be on
earthquake in the form of RRS, i.e. acceleration the safer side, as prescribed by TEEE 344 and illustrated
characteristic curves, period versus spectral acceleration, in Figure 14.25. The table is actuated to obtain an
such as those in Figure 14.18. The first objective is to acceleration equal to at least the ZPA of the respective
generate a signal which should be able to produce a time RRS as noted above. Shortcomings in the TRS, if any,
history, on a shake table, whose response spectra match are compensated by readjusting the control signals to the
those of the RRS. table actuators and the actual tests are carried out on the
The RRS is simulated on the shake table, generally test object as follows.
without the test object to protect it from repeated shocks.
This is done in all three directions, X, Y and 2, by shaking 1 OBE test
the table in the respective direction and adjusting its
movement according to the relevant RRS. The maximum Passive test The test object is mounted on the shake
acceleration of the table is kept higher than the spectral table and subjected to both horizontal (X and Y)
acceleration corresponding to the ZPA of the relevant movements or one cumulative orthogonal horizontal
RRS, subject to a minimum of 0.1 g for an OBE and and one vertical ground movement simultaneously.
0.5 g for an SSE test, as discussed above. The movement Accelerometers are mounted on the shake table to
of the table is recorded as ‘time versus g’ (Figure 14.24(b)). measure its movements and also on the test object at
If the three directional facility is not available, the two its most vulnerable points. These points may be
orthogonal RRS of the horizontal directions X-X’ and identified by the manufacturer or the user to monitor
Y-Y’ can be superimposed on each other to obtain an the behaviour of the object in such locations.
equivalent horizontal RRS analytically as shown in Figure The test is conducted for nearly 20 seconds, of
14.26. This is a permissible procedure equivalent which at least 15 seconds are covered for the strong
horizontal RRS is then translated into the shake system. movement (Figure 14.24(b)) the remaining 5 seconds
1 .og
.. ;;:;\
C
....
c
F? ..
..
P ..
8 0.6g
0
7
..
..
..
..
..
..
..
...
0.49 ..
..
....
..
....
0.29
10.0 rns 100.0 ms 1.0 s 10.0 s
Natural period (seconds) +
Figure 14.25 Comparison of the test conditions (TRS) with the required conditions (RRS). This is established in all three directions