
Page 290 - Industrial Process Plant Construction Estimating and Man Hour Analysis
P. 290
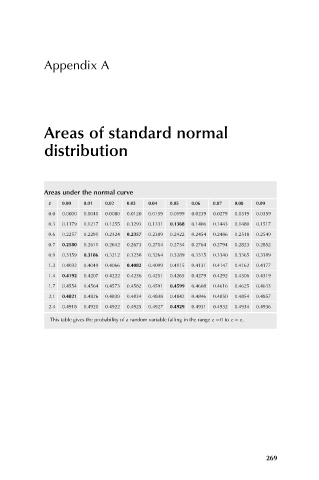
Appendix A


             Areas of standard normal

             distribution


             Areas under the normal curve
              z   0.00  0.01  0.02  0.03  0.04  0.05  0.06  0.07  0.08  0.09
              0.0  0.0000  0.0040  0.0080  0.0120  0.0159  0.0199  0.0239  0.0279  0.0319  0.0359
              0.3  0.1179  0.1217  0.1255  0.1293  0.1331  0.1368  0.1406  0.1443  0.1480  0.1517
              0.6  0.2257  0.2291  0.2324  0.2357  0.2389  0.2422  0.2454  0.2486  0.2518  0.2549
              0.7  0.2580  0.2611  0.2642  0.2673  0.2704  0.2734  0.2764  0.2794  0.2823  0.2852
              0.9  0.3159  0.3186  0.3212  0.3238  0.3264  0.3289  0.3315  0.3340  0.3365  0.3389
              1.3  0.4032  0.4049  0.4066  0.4082  0.4099  0.4115  0.4131  0.4147  0.4162  0.4177
              1.4  0.4192  0.4207  0.4222  0.4236  0.4251  0.4265  0.4279  0.4292  0.4306  0.4319
              1.7  0.4554  0.4564  0.4573  0.4582  0.4591  0.4599  0.4608  0.4616  0.4625  0.4633
              2.1  0.4821  0.4826  0.4830  0.4834  0.4838  0.4842  0.4846  0.4850  0.4854  0.4857
              2.4  0.4918  0.4920  0.4922  0.4925  0.4927  0.4929  0.4931  0.4932  0.4934  0.4936

               This table gives the probability of a random variable falling in the range z ¼0toz ¼ z.


                                                                         269