
Page 286 - Industrial Process Plant Construction Estimating and Man Hour Analysis
P. 286
Statistical applications to construction Chapter 12 265
1.20
1.00
Probability 0.60
0.80
0.40
0.20
0.00
$25,800.00 $25,900.00 $26,000.00 $26,100.00 $26,200.00 $26,300.00 $26,400.00 $26,500.00 $26,600.00
Project range ($)
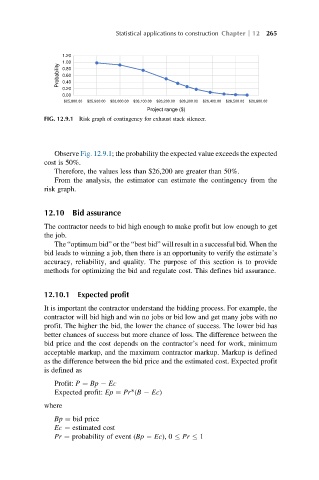
FIG. 12.9.1 Risk graph of contingency for exhaust stack silencer.
Observe Fig. 12.9.1; the probability the expected value exceeds the expected
cost is 50%.
Therefore, the values less than $26,200 are greater than 50%.
From the analysis, the estimator can estimate the contingency from the
risk graph.
12.10 Bid assurance
The contractor needs to bid high enough to make profit but low enough to get
the job.
The “optimum bid” or the “best bid” will result in a successful bid. When the
bid leads to winning a job, then there is an opportunity to verify the estimate’s
accuracy, reliability, and quality. The purpose of this section is to provide
methods for optimizing the bid and regulate cost. This defines bid assurance.
12.10.1 Expected profit
It is important the contractor understand the bidding process. For example, the
contractor will bid high and win no jobs or bid low and get many jobs with no
profit. The higher the bid, the lower the chance of success. The lower bid has
better chances of success but more chance of loss. The difference between the
bid price and the cost depends on the contractor’s need for work, minimum
acceptable markup, and the maximum contractor markup. Markup is defined
as the difference between the bid price and the estimated cost. Expected profit
is defined as
Profit: P ¼ Bp Ec
Expected profit: Ep ¼ Pr*(B Ec)
where
Bp ¼ bid price
Ec ¼ estimated cost
Pr ¼ probability of event (Bp Ec), 0 Pr 1