
Page 289 - Industrial Process Plant Construction Estimating and Man Hour Analysis
P. 289
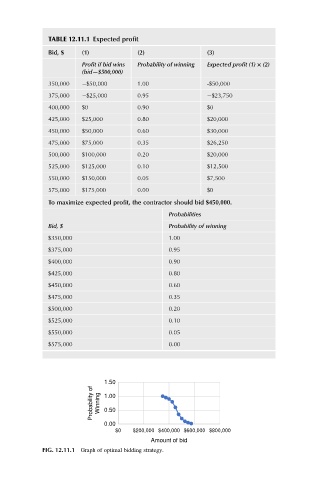
TABLE 12.11.1 Expected profit
              Bid, $   (1)            (2)                (3)
                       Profit if bid wins  Probability of winning  Expected profit (1) × (2)
                       (bid—$500,000)
              350,000   $50,000       1.00               -$50,000
              375,000   $25,000       0.95                $23,750
              400,000  $0             0.90               $0
              425,000  $25,000        0.80               $20,000
              450,000  $50,000        0.60               $30,000
              475,000  $75,000        0.35               $26,250
              500,000  $100,000       0.20               $20,000
              525,000  $125,000       0.10               $12,500
              550,000  $150,000       0.05               $7,500
              575,000  $175,000       0.00               $0
              To maximize expected profit, the contractor should bid $450,000.
                                               Probabilities
              Bid, $                           Probability of winning
              $350,000                         1.00
              $375,000                         0.95
              $400,000                         0.90
              $425,000                         0.80
              $450,000                         0.60
              $475,000                         0.35
              $500,000                         0.20
              $525,000                         0.10
              $550,000                         0.05
              $575,000                         0.00


                             1.50
                          Probability of  Winning  1.00


                             0.50
                             0.00
                                $0   $200,000 $400,000 $600,000 $800,000
                                          Amount of bid
            FIG. 12.11.1 Graph of optimal bidding strategy.