
Page 282 - Industrial Process Plant Construction Estimating and Man Hour Analysis
P. 282
Statistical applications to construction Chapter 12 261
P
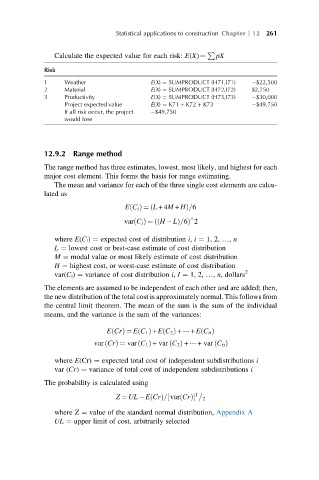
Calculate the expected value for each risk: E(X)¼ pX
Risk
1 Weather E(X) ¼ SUMPRODUCT (H71,I71) $22,500
2 Material E(X) ¼ SUMPRODUCT (H72,I72) $2,750
3 Productivity E(X) ¼ SUMPRODUCT (H73,I73) $30,000
Project expected value E(X) ¼ K71 + K72 + K73 $49,750
If all risk occur, the project $49,750
would lose
12.9.2 Range method
The range method has three estimates, lowest, most likely, and highest for each
major cost element. This forms the basis for range estimating.
The mean and variance for each of the three single cost elements are calcu-
lated as
EC i ¼ L +4M + Hð Þ=6
ðÞ
^
ðÞ
var C i ¼ H Lðð Þ=6Þ 2
where E(Cᵢ) ¼ expected cost of distribution i, i ¼ 1, 2, …, n
L ¼ lowest cost or best-case estimate of cost distribution
M ¼ modal value or most likely estimate of cost distribution
H ¼ highest cost, or worst-case estimate of cost distribution
var(Cᵢ) ¼ variance of cost distribution i, I ¼ 1, 2, …, n, dollars 2
The elements are assumed to be independent of each other and are added; then,
the new distribution of the total cost is approximately normal. This follows from
the central limit theorem. The mean of the sum is the sum of the individual
means, and the variance is the sum of the variances:
ð
ð
ð
ð
ECrÞ ¼ EC 1 Þ + EC 2 Þ + ⋯ + EC n Þ
ð
ð
ð
var CrÞ ¼ var C 1 Þ + var C 2 Þ + ⋯ + var C n Þ
ð
where E(Cr) ¼ expected total cost of independent subdistributions i
var (Cr) ¼ variance of total cost of independent subdistributions i
The probability is calculated using
1
ð
Z ¼ UL ECrÞ= var CrÞ 2
½
ð
where Z ¼ value of the standard normal distribution, Appendix A
UL ¼ upper limit of cost, arbitrarily selected