
Page 279 - Industrial Process Plant Construction Estimating and Man Hour Analysis
P. 279
258 Industrial process plant construction estimating and man-hour analysis
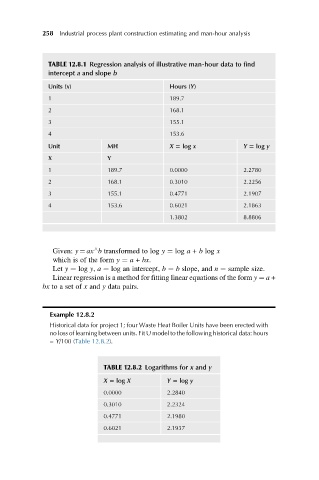
TABLE 12.8.1 Regression analysis of illustrative man-hour data to find
intercept a and slope b
Units (x) Hours (Y)
1 189.7
2 168.1
3 155.1
4 153.6
Unit MH X 5 log x Y 5 log y
X Y
1 189.7 0.0000 2.2780
2 168.1 0.3010 2.2256
3 155.1 0.4771 2.1907
4 153.6 0.6021 2.1863
1.3802 8.8806
Given: y ¼ ax b transformed to log y ¼ log a + b log x
^
which is of the form y ¼ a + bx.
Let y ¼ log y, a ¼ log an intercept, b ¼ b slope, and n ¼ sample size.
Linear regression is a method for fitting linear equations of the form y ¼ a +
bx to a set of x and y data pairs.
Example 12.8.2
Historical data for project 1; four Waste Heat Boiler Units have been erected with
no loss of learning between units. Fit U model to the following historical data: hours
= Y/100 (Table 12.8.2).
TABLE 12.8.2 Logarithms for x and y
X 5 log X Y 5 log y
0.0000 2.2840
0.3010 2.2324
0.4771 2.1980
0.6021 2.1937