
Page 281 - Industrial Process Plant Construction Estimating and Man Hour Analysis
P. 281
260 Industrial process plant construction estimating and man-hour analysis
X X
EXðÞ ¼ p1X1+ p2X2+ ⋯ + p i X i ¼ pjXj ¼ pX
where E(X) ¼ expected value of the estimate for event i
pj ¼ probability that X takes on value Xj,0 Pj (Xj) 1
Xj ¼ event
The pj represents the independent probabilities that their associative Xj will
occur with Σpj ¼ 1. The expected-value method exposes the degree of risk when
reporting information in the estimating process.
Application of the expected value method
Consider the following application of the expected-value method for the con-
struction of an industrial process plant.
The plant will be built in the winter, and the probability is 30% due to excess
snow that will delay the mechanical construction for two weeks and cost the
project $75,000. Market research indicates there is a 5% probability that the cost
of construction material will save the project $55,000. There is a 10% labor pro-
ductivity factor that will impact the piping installation and cost the project
$300,000.
To use the Math Formulas, go to quick access toolbar; select Math & Trig,
and then, select SUMPRODUCT.
SUMPRODUCT ¼ Returns the sum of the products of corresponding ranges
or arrays.
Arrays 1, 2, and 3 are 2–255 arrays for which you want to multiply and then
add components. All arrays must have the same dimensions.
Math & Trig functions are used to calculate values for data.
To use SUMPRODUCT (array 1, array 2, and array 3), highlight the
array of values for (array 1), highlight the array of values (array R 2 ), and high-
light the array of values (array 3).
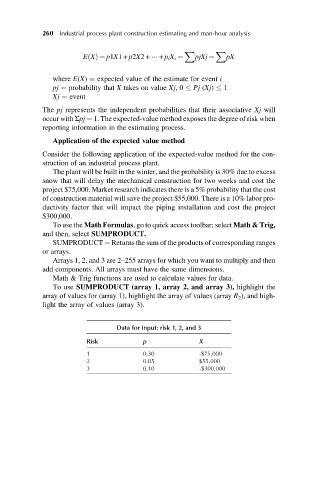
Data for input: risk 1, 2, and 3
Risk p X
1 0.30 -$75,000
2 0.05 $55,000
3 0.10 -$300,000