
Page 276 - Industrial Process Plant Construction Estimating and Man Hour Analysis
P. 276
Statistical applications to construction Chapter 12 255
Average man hour 1500
1000
500
0
1 2 3 4 5 6 7 8
Series1 Series2
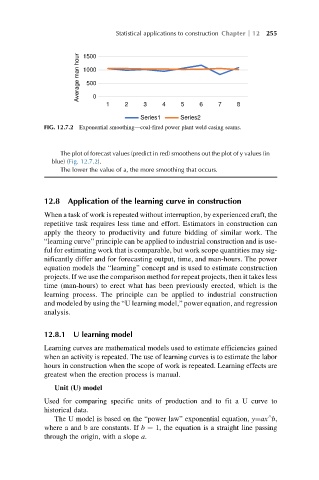
FIG. 12.7.2 Exponential smoothing—coal-fired power plant weld casing seams.
The plot of forecast values (predict in red) smoothens out the plot of y values (in
blue) (Fig. 12.7.2).
The lower the value of a, the more smoothing that occurs.
12.8 Application of the learning curve in construction
When a task of work is repeated without interruption, by experienced craft, the
repetitive task requires less time and effort. Estimators in construction can
apply the theory to productivity and future bidding of similar work. The
“learning curve” principle can be applied to industrial construction and is use-
ful for estimating work that is comparable, but work scope quantities may sig-
nificantly differ and for forecasting output, time, and man-hours. The power
equation models the “learning” concept andisusedtoestimateconstruction
projects. If we use the comparison method for repeat projects, then it takes less
time (man-hours) to erect what has been previously erected, which is the
learning process. The principle can be applied to industrial construction
and modeled by using the “U learning model,” power equation, and regression
analysis.
12.8.1 U learning model
Learning curves are mathematical models used to estimate efficiencies gained
when an activity is repeated. The use of learning curves is to estimate the labor
hours in construction when the scope of work is repeated. Learning effects are
greatest when the erection process is manual.
Unit (U) model
Used for comparing specific units of production and to fit a U curve to
historical data.
^
The U model is based on the “power law” exponential equation, y¼ax b,
where a and b are constants. If b ¼ 1, the equation is a straight line passing
through the origin, with a slope a.