
Page 271 - Industrial Process Plant Construction Estimating and Man Hour Analysis
P. 271
250 Industrial process plant construction estimating and man-hour analysis
Example 12.5.3
Coal-fired power plant—spool duct (Table 12.5.3)
Scope of field work for assemble and field erect—spool duct
Spool duct
Casing panel
Casing panel
Roof casing with tube bundle assembly
Data for input: Man-hours for spool duct
Quantity (y): R 1 = 307.4, 175.4, and 175.4
Man-hour (x): R 2 = 107.6, 61.4, and 61.4
TABLE 12.5.3 Linear regression: fitting a straight line
Man-hour Quantity
Description X Y
Spool duct
Casing panel 107.6 307.4
Casing panel 61.4 175.4
Roof casing with tube bundle assembly 61.4 175.4
COVAR (R 1 , R 2 ) 1355.20
VARP (R 2 ) 474.32
SLOPE (R 1 , R 2 ) 2.86
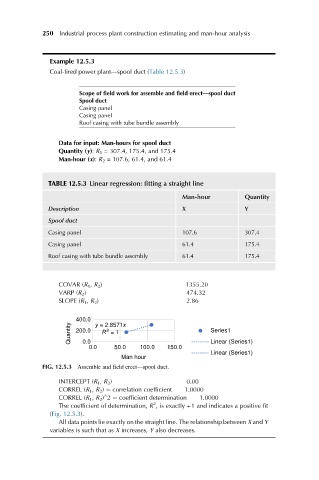
400.0 y = 2.8571x
Quantity 200.0 R = 1 Series1
2
0.0
0.0 50.0 100.0 150.0 Linear (Series1)
Linear (Series1)
Man hour
FIG. 12.5.3 Assemble and field erect—spool duct.
INTERCEPT (R 1 , R 2 ) 0.00
CORREL (R 1 , R 2 ) ¼ correlation coefficient 1.0000
^
CORREL (R 1 , R 2 ) 2 ¼ coefficient determination 1.0000
2
The coefficient of determination, R , is exactly +1 and indicates a positive fit
(Fig. 12.5.3).
All data points lie exactly on the straight line. The relationship between X and Y
variables is such that as X increases, Y also decreases.