Page 272 - Industrial Process Plant Construction Estimating and Man Hour Analysis
P. 272

Statistical applications to construction Chapter  12 251


             12.6 Method of least squares for process piping

               Example 12.6.1
               Handle and install PVC pipe (Table 12.6.1)
                 Facility—Industrial plant
                 Data for input: Man-hours PVC piping
                 Man-hour (y): R 1 = 0.12, 0.12, 0.14, 0.18, 0.28, 0.37, 0.46, and 0.55
                 Pipe size, inches (x): R 2 = 2, 2.5, 3, 4, 6, 8, 10, and 12
                 Man-hour per lineal feet


                          TABLE 12.6.1 Handle and install PVC piping

                          X                    Y
                          Pipe
                          Size                 MH/LF
                          2                    0.12
                          2.5                  0.12
                          3                    0.14
                          4                    0.18
                          6                    0.28
                          8                    0.37
                          10                   0.46
                          12                   0.55


                 COVAR (R 1 , R 2 )           0.55
                 VARP (R 2 )                  0.02
                 SLOPE (R 1 , R 2 )           0.0451
                 INTERCEPT (R 1 , R 2 )       0.0084

                  0.60
                       y = 0.0451x + 0.0084
                           2
                MH/LF     R  = 0.9981                          Series1
                  0.40
                  0.20
                                                               Linear (Series1)
                  0.00                                         Linear (Series1)
                     0          5          10        15
                               Pipe diameter (in.)
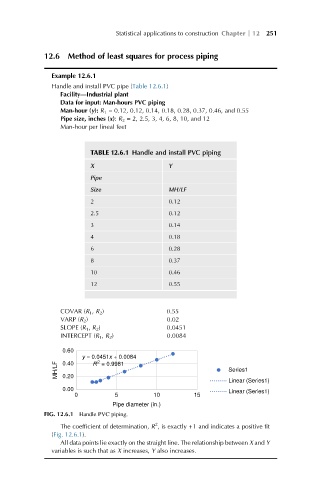
             FIG. 12.6.1 Handle PVC piping.
                                           2
                 The coefficient of determination, R , is exactly +1 and indicates a positive fit
               (Fig. 12.6.1).
                 All data points lie exactly on the straight line. The relationship between X and Y
               variables is such that as X increases, Y also increases.
   267   268   269   270   271   272   273   274   275   276   277