
Page 274 - Industrial Process Plant Construction Estimating and Man Hour Analysis
P. 274
Statistical applications to construction Chapter 12 253
2.00
1.50 y = 0.0596x + 0.0067
2
MH/LF 1.00 R = 0.9997 Series1
0.50 Linear (Series1)
Linear (Series1)
0.00
0 10 20 30
Pipe diameter (in.)
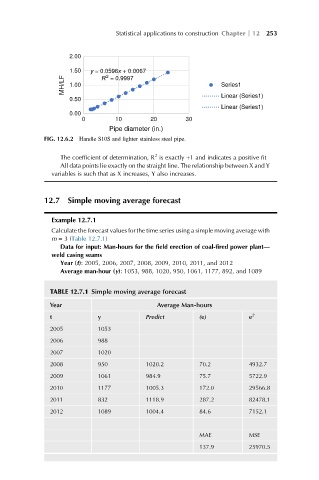
FIG. 12.6.2 Handle S10S and lighter stainless steel pipe.
2
The coefficient of determination, R is exactly +1 and indicates a positive fit
All data points lie exactly on the straight line. The relationship between X and Y
variables is such that as X increases, Y also increases.
12.7 Simple moving average forecast
Example 12.7.1
Calculate the forecast values for the time series using a simple moving average with
m =3 (Table 12.7.1)
Data for input: Man-hours for the field erection of coal-fired power plant—
weld casing seams
Year (t): 2005, 2006, 2007, 2008, 2009, 2010, 2011, and 2012
Average man-hour (y): 1053, 988, 1020, 950, 1061, 1177, 892, and 1089
TABLE 12.7.1 Simple moving average forecast
Year Average Man-hours
t y Predict (e) e 2
2005 1053
2006 988
2007 1020
2008 950 1020.2 70.2 4932.7
2009 1061 984.9 75.7 5722.9
2010 1177 1005.3 172.0 29566.8
2011 832 1118.9 287.2 82478.1
2012 1089 1004.4 84.6 7152.1
MAE MSE
137.9 25970.5