
Page 270 - Industrial Process Plant Construction Estimating and Man Hour Analysis
P. 270
Statistical applications to construction Chapter 12 249
TABLE 12.5.2 Linear regression: fitting a straight line
Man-hour Quantity
Description X Y
FD fan
Set fan and seal weld housing 140 2
Coupling alignment 40 0.5
Install damper 60 1
COVAR (R 1 , R 2 ) 26.67
VARP (R 2 ) 1866.67
SLOPE (R 1 , R 2 ) 0.01
INTERCEPT (R 1 , R 2 ) 0.02
3 y = 0.0143x + 0.0238
Quantity 2 1 R = 0.9796 Series1
2
0 Linear (Series1)
0 50 100 150 Linear (Series1)
Man hour
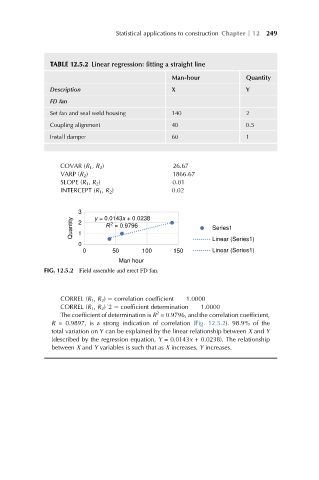
FIG. 12.5.2 Field assemble and erect FD fan.
CORREL (R 1 , R 2 ) ¼ correlation coefficient 1.0000
CORREL (R 1 , R 2 )^2 ¼ coefficient determination 1.0000
2
The coefficient of determination is R = 0.9796, and the correlation coefficient,
R = 0.9897, is a strong indication of correlation (Fig. 12.5.2). 98.9% of the
total variation on Y can be explained by the linear relationship between X and Y
(described by the regression equation, Y = 0.0143x + 0.0238). The relationship
between X and Y variables is such that as X increases, Y increases.