
Page 265 - Industrial Process Plant Construction Estimating and Man Hour Analysis
P. 265
244 Industrial process plant construction estimating and man-hour analysis
30.00
y = 0.9x Series1
20.00
MH/EA 10.00 R = 1 Linear
2
(Series1)
0.00 Linear
0 10 20 30
(Series1)
Pipe diameter (in)
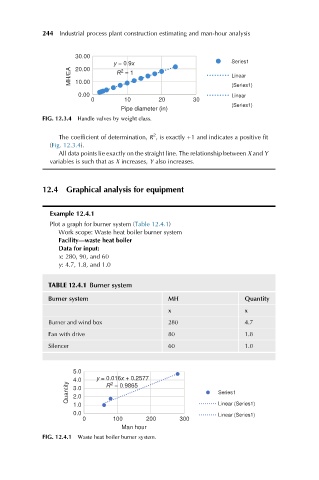
FIG. 12.3.4 Handle valves by weight class.
2
The coefficient of determination, R , is exactly +1 and indicates a positive fit
(Fig. 12.3.4).
All data points lie exactly on the straight line. The relationship between X and Y
variables is such that as X increases, Y also increases.
12.4 Graphical analysis for equipment
Example 12.4.1
Plot a graph for burner system (Table 12.4.1)
Work scope: Waste heat boiler burner system
Facility—waste heat boiler
Data for input:
x: 280, 90, and 60
y: 4.7, 1.8, and 1.0
TABLE 12.4.1 Burner system
Burner system MH Quantity
x x
Burner and wind box 280 4.7
Fan with drive 80 1.8
Silencer 60 1.0
5.0
4.0 y = 0.016x + 0.2577
Quantity 3.0 Series1
2
R = 0.9865
2.0
1.0 Linear (Series1)
0.0 Linear (Series1)
0 100 200 300
Man hour
FIG. 12.4.1 Waste heat boiler burner system.