
Page 266 - Industrial Process Plant Construction Estimating and Man Hour Analysis
P. 266
Statistical applications to construction Chapter 12 245
2
The coefficient of determination is R = 0.9865, and the correlation coefficient,
R = 0.9932, is a strong indication of correlation (Fig. 12.4.1). The relationship
between X and Y variables are such that as X increases, Y increases.
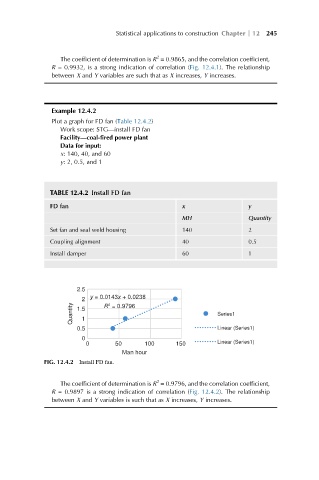
Example 12.4.2
Plot a graph for FD fan (Table 12.4.2)
Work scope: STG—install FD fan
Facility—coal-fired power plant
Data for input:
x: 140, 40, and 60
y: 2, 0.5, and 1
TABLE 12.4.2 Install FD fan
FD fan x y
MH Quantity
Set fan and seal weld housing 140 2
Coupling alignment 40 0.5
Install damper 60 1
2.5
2 y = 0.0143x + 0.0238
Quantity 1.5 1 R = 0.9796 Series1
2
0.5 Linear (Series1)
0
0 50 100 150 Linear (Series1)
Man hour
FIG. 12.4.2 Install FD fan.
2
The coefficient of determination is R = 0.9796, and the correlation coefficient,
R = 0.9897 is a strong indication of correlation (Fig. 12.4.2). The relationship
between X and Y variables is such that as X increases, Y increases.