
Page 263 - Industrial Process Plant Construction Estimating and Man Hour Analysis
P. 263
242 Industrial process plant construction estimating and man-hour analysis
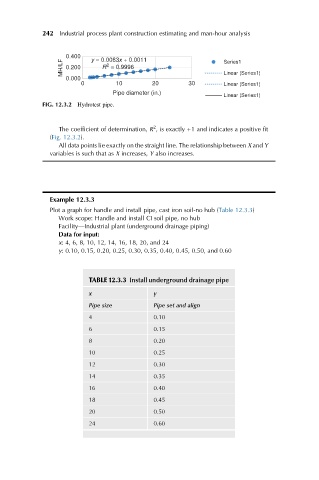
0.400 y = 0.0083x + 0.0011 Series1
MH/LF 0.200 R = 0.9996 Linear (Series1)
2
0.000
0 10 20 30 Linear (Series1)
Pipe diameter (in.)
Linear (Series1)
FIG. 12.3.2 Hydrotest pipe.
2
The coefficient of determination, R , is exactly +1 and indicates a positive fit
(Fig. 12.3.2).
All data points lie exactly on the straight line. The relationship between X and Y
variables is such that as X increases, Y also increases.
Example 12.3.3
Plot a graph for handle and install pipe, cast iron soil-no hub (Table 12.3.3)
Work scope: Handle and install CI soil pipe, no hub
Facility—Industrial plant (underground drainage piping)
Data for input:
x: 4, 6, 8, 10, 12, 14, 16, 18, 20, and 24
y: 0.10, 0.15, 0.20, 0.25, 0.30, 0.35, 0.40, 0.45, 0.50, and 0.60
TABLE 12.3.3 Install underground drainage pipe
x y
Pipe size Pipe set and align
4 0.10
6 0.15
8 0.20
10 0.25
12 0.30
14 0.35
16 0.40
18 0.45
20 0.50
24 0.60