Page 262 - Industrial Process Plant Construction Estimating and Man Hour Analysis
P. 262

Statistical applications to construction Chapter  12 241


                                           2
                 The coefficient of determination, R , is exactly +1 and indicates a positive fit
               (Fig. 12.3.1).
                 All data points lie exactly on the straight line. The relationship between X and Y
               variables is such that as X increases, Y also increases.
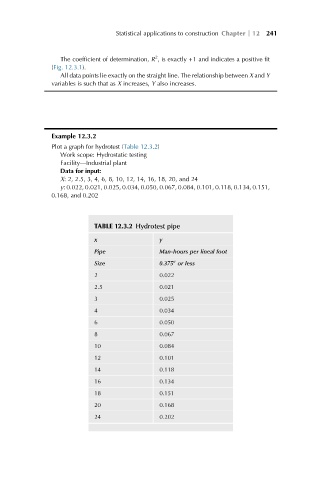


               Example 12.3.2
               Plot a graph for hydrotest (Table 12.3.2)
                 Work scope: Hydrostatic testing
                 Facility—Industrial plant
                 Data for input:
                 X: 2, 2.5, 3, 4, 6, 8, 10, 12, 14, 16, 18, 20, and 24
                 y: 0.022, 0.021, 0.025, 0.034, 0.050, 0.067, 0.084, 0.101, 0.118, 0.134, 0.151,
               0.168, and 0.202


                           TABLE 12.3.2 Hydrotest pipe
                           x                y
                           Pipe             Man-hours per lineal foot
                           Size             0.375 or less
                                                00
                          2                 0.022
                          2.5               0.021
                          3                 0.025
                          4                 0.034
                          6                 0.050
                          8                 0.067
                          10                0.084
                          12                0.101
                          14                0.118
                          16                0.134
                          18                0.151
                          20                0.168
                          24                0.202
   257   258   259   260   261   262   263   264   265   266   267