
Page 264 - Industrial Process Plant Construction Estimating and Man Hour Analysis
P. 264
Statistical applications to construction Chapter 12 243
0.80
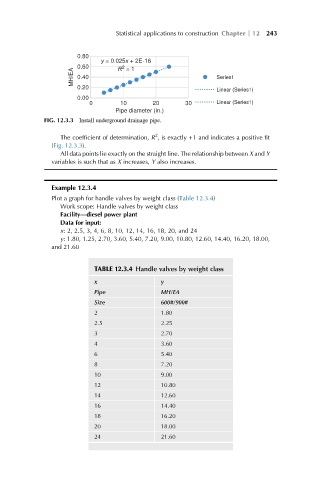
y = 0.025x + 2E-16
0.60 R = 1
2
MH/EA 0.40 Series1
0.20 Linear (Series1)
0.00
0 10 20 30 Linear (Series1)
Pipe diameter (in.)
FIG. 12.3.3 Install underground drainage pipe.
2
The coefficient of determination, R , is exactly +1 and indicates a positive fit
(Fig. 12.3.3).
All data points lie exactly on the straight line. The relationship between X and Y
variables is such that as X increases, Y also increases.
Example 12.3.4
Plot a graph for handle valves by weight class (Table 12.3.4)
Work scope: Handle valves by weight class
Facility—diesel power plant
Data for input:
x: 2, 2.5, 3, 4, 6, 8, 10, 12, 14, 16, 18, 20, and 24
y: 1.80, 1.25, 2.70, 3.60, 5.40, 7.20, 9.00, 10.80, 12.60, 14.40, 16.20, 18.00,
and 21.60
TABLE 12.3.4 Handle valves by weight class
x y
Pipe MH/EA
Size 600#/900#
2 1.80
2.5 2.25
3 2.70
4 3.60
6 5.40
8 7.20
10 9.00
12 10.80
14 12.60
16 14.40
18 16.20
20 18.00
24 21.60