
Page 261 - Industrial Process Plant Construction Estimating and Man Hour Analysis
P. 261
240 Industrial process plant construction estimating and man-hour analysis
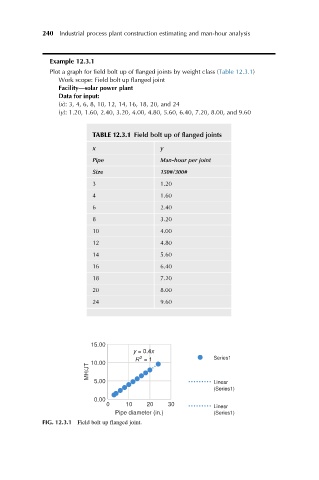
Example 12.3.1
Plot a graph for field bolt up of flanged joints by weight class (Table 12.3.1)
Work scope: Field bolt up flanged joint
Facility—solar power plant
Data for input:
(x): 3, 4, 6, 8, 10, 12, 14, 16, 18, 20, and 24
(y): 1.20, 1.60, 2.40, 3.20, 4.00, 4.80, 5.60, 6.40, 7.20, 8.00, and 9.60
TABLE 12.3.1 Field bolt up of flanged joints
x y
Pipe Man-hour per joint
Size 150#/300#
3 1.20
4 1.60
6 2.40
8 3.20
10 4.00
12 4.80
14 5.60
16 6.40
18 7.20
20 8.00
24 9.60
15.00
y = 0.4x
2
R = 1 Series1
10.00
MH/JT
5.00 Linear
(Series1)
0.00
0 10 20 30
Linear
Pipe diameter (in.) (Series1)
FIG. 12.3.1 Field bolt up flanged joint.