
Page 259 - Industrial Process Plant Construction Estimating and Man Hour Analysis
P. 259
238 Industrial process plant construction estimating and man-hour analysis
TABLE 12.2.1 Spreadsheet example for the analysis for welding the
condensate headers
Project: Air-cooled condenser—condensate headers
Foreman: John Smith: Date: 0000 June 00
Craft: Boilermaker
Cost code Phase code description MH Qty
Condensate headers
000000 16 Schedule 10 BW CS 12.00 2.00
00
000000 18 Schedule 10 BW CS 13.50 4.00
00
TABLE 12.2.2 Condensate Headers-air cooled condenser
Phase code description MH Qty Bins
Condensate headers
16 Schedule 10 BW CS 12.00 2.00 4.00
00
00
18 Schedule 10 BW CS 13.50 4.00 2.00
Graphic analysis of data
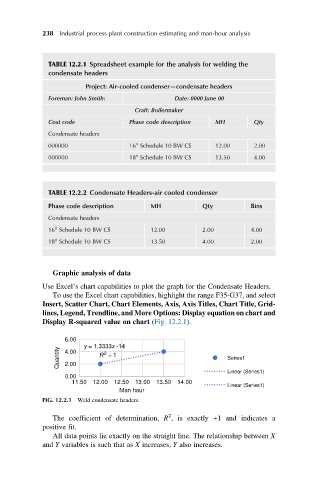
Use Excel’s chart capabilities to plot the graph for the Condensate Headers.
To use the Excel chart capabilities, highlight the range F35-G37, and select
Insert, Scatter Chart, Chart Elements, Axis, Axis Titles, Chart Title, Grid-
lines, Legend, Trendline, and More Options: Display equation on chart and
Display R-squared value on chart (Fig. 12.2.1).
6.00
y = 1.3333x -14
Quantity 2.00 R = 1 Series1
4.00
2
Linear (Series1)
0.00
11.50 12.00 12.50 13.00 13.50 14.00
Linear (Series1)
Man hour
FIG. 12.2.1 Weld condensate headers.
2
The coefficient of determination, R , is exactly +1 and indicates a
positive fit.
All data points lie exactly on the straight line. The relationship between X
and Y variables is such that as X increases, Y also increases.