
Page 268 - Industrial Process Plant Construction Estimating and Man Hour Analysis
P. 268
Statistical applications to construction Chapter 12 247
1000
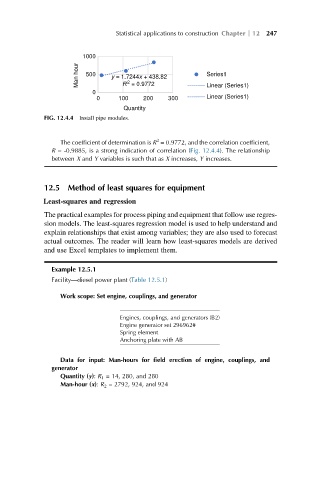
Man hour 500 y = 1.7244x + 438.82 Series1
2
R = 0.9772
0 Linear (Series1)
0 100 200 300 Linear (Series1)
Quantity
FIG. 12.4.4 Install pipe modules.
2
The coefficient of determination is R = 0.9772, and the correlation coefficient,
R = -0.9885, is a strong indication of correlation (Fig. 12.4.4). The relationship
between X and Y variables is such that as X increases, Y increases.
12.5 Method of least squares for equipment
Least-squares and regression
The practical examples for process piping and equipment that follow use regres-
sion models. The least-squares regression model is used to help understand and
explain relationships that exist among variables; they are also used to forecast
actual outcomes. The reader will learn how least-squares models are derived
and use Excel templates to implement them.
Example 12.5.1
Facility—diesel power plant (Table 12.5.1)
Work scope: Set engine, couplings, and generator
Engines, couplings, and generators (B2)
Engine generator set 296962#
Spring element
Anchoring plate with AB
Data for input: Man-hours for field erection of engine, couplings, and
generator
Quantity (y): R 1 = 14, 280, and 280
Man-hour (x): R 2 = 2792, 924, and 924