
Page 269 - Industrial Process Plant Construction Estimating and Man Hour Analysis
P. 269
248 Industrial process plant construction estimating and man-hour analysis
TABLE 12.5.1 Linear regression: fitting a straight line
Description Quantity MH
Y X
Engines, couplings, and generators (B2)
Engine generator set 296962# 14 2792
Spring element 280 924
Anchoring plate with AB 280 924
COVAR (R 1 , R 2 ) 110419.56
VARP (R 2 ) 15723.56
SLOPE (R 1 , R 2 ) 7.02
INTERCEPT (R 1 , R 2 ) 2890.32
3000
2500
Man hour 2000 y = –7.0226x + 2890.3 Series1
1500
1000
2
500 R = 1 Linear (Series1)
0 Linear (Series1)
0 100 200 300
Quantity
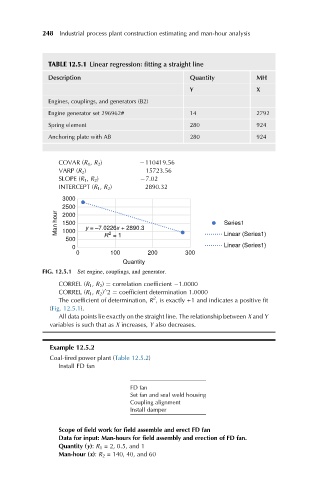
FIG. 12.5.1 Set engine, couplings, and generator.
CORREL (R 1 , R 2 ) ¼ correlation coefficient 1.0000
CORREL (R 1 , R 2 ) 2 ¼ coefficient determination 1.0000
^
2
The coefficient of determination, R , is exactly +1 and indicates a positive fit
(Fig. 12.5.1).
All data points lie exactly on the straight line. The relationship between X and Y
variables is such that as X increases, Y also decreases.
Example 12.5.2
Coal-fired power plant (Table 12.5.2)
Install FD fan
FD fan
Set fan and seal weld housing
Coupling alignment
Install damper
Scope of field work for field assemble and erect FD fan
Data for input: Man-hours for field assembly and erection of FD fan.
Quantity (y): R 1 = 2, 0.5, and 1
Man-hour (x): R 2 = 140, 40, and 60