
Page 280 - Industrial Process Plant Construction Estimating and Man Hour Analysis
P. 280
Statistical applications to construction Chapter 12 259
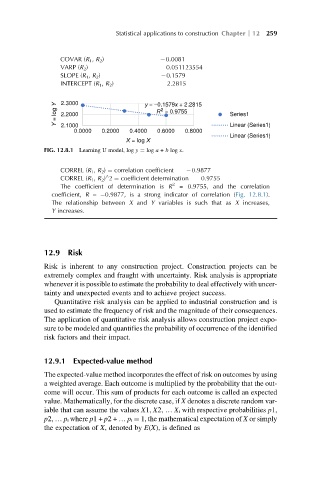
COVAR (R 1 , R 2 ) 0.0081
VARP (R 2 ) 0.051123554
SLOPE (R 1 , R 2 ) 0.1579
INTERCEPT (R 1 , R 2 ) 2.2815
Y = log Y 2.3000 y = –0.1579x + 2.2815 Series1
2
R = 0.9755
2.2000
2.1000
0.0000 0.2000 0.4000 0.6000 0.8000 Linear (Series1)
Linear (Series1)
X = log X
FIG. 12.8.1 Learning U model, log y ¼ log a + b log x.
CORREL (R 1 , R 2 ) ¼ correlation coefficient 0.9877
^
CORREL (R 1 , R 2 ) 2 ¼ coefficient determination 0.9755
The coefficient of determination is R 2 = 0.9755, and the correlation
coefficient, R = 0.9877, is a strong indicator of correlation (Fig. 12.8.1).
The relationship between X and Y variables is such that as X increases,
Y increases.
12.9 Risk
Risk is inherent to any construction project. Construction projects can be
extremely complex and fraught with uncertainty. Risk analysis is appropriate
whenever it is possible to estimate the probability to deal effectively with uncer-
tainty and unexpected events and to achieve project success.
Quantitative risk analysis can be applied to industrial construction and is
used to estimate the frequency of risk and the magnitude of their consequences.
The application of quantitative risk analysis allows construction project expo-
sure to be modeled and quantifies the probability of occurrence of the identified
risk factors and their impact.
12.9.1 Expected-value method
The expected-value method incorporates the effect of risk on outcomes by using
a weighted average. Each outcome is multiplied by the probability that the out-
come will occur. This sum of products for each outcome is called an expected
value. Mathematically, for the discrete case, if X denotes a discrete random var-
iable that can assume the values X1, X2, … Xᵢ with respective probabilities p1,
p2, … pᵢ where p1+ p2+ … pᵢ ¼ 1, the mathematical expectation of X or simply
the expectation of X, denoted by E(X), is defined as