
Page 38 - Industrial Process Plant Construction Estimating and Man Hour Analysis
P. 38
8 Industrial process plant construction estimating and man-hour analysis
Template 1.4
Calculate the regression line for the historical data in Example 1.4 and plot the
results.
Scope of field work for boiler tube replacement
Remove and install new boiler generating tubes
Boiler scaffold, rigging, drum internals and remove boiler trim
Remove soot blowers and casing
Remove tubes and install new tubes
Reinstall casing, trim, soot blowers, test, and clean up.
Data for input: man-hours for field installation of new boiler generating tubes
Quantity (y): R1 ¼1.0, 2.0, 4.0, and 5.0
Man-hour (x):R2 ¼172, 210, 525.2, and 746
TABLE 1.4.1 Linear regression: Fitting a straight line man-hour quantity
Description x y
Boiler tube replacement
Boiler scaffold, rigging, drum internals, and remove boiler trim 172 1.0
Remove soot blowers and casing 210 2.0
Remove tubes and install new tubes 515.2 4.0
Reinstall casing, trim, soot blowers, test and clean up 746 5.0
COVAR (R1, R2)¼COVAR (D172-D175; E172-E175) 363.30
VARP (R2)¼VARP (E172-E175) 55151.1200
SLOPE (R1, R2)¼Slope (E172-E175; D172-D175) 0.0066
INTERCEPT (R1, R2)¼INTERCEPT (E172-E175; D172-D175) 0.2939
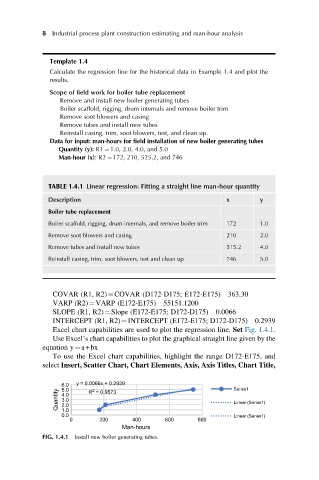
Excel chart capabilities are used to plot the regression line. Set Fig. 1.4.1.
Use Excel’s chart capabilities to plot the graphical straight line given by the
equation y¼a+bx .
To use the Excel chart capabilities, highlight the range D172-E175, and
select Insert, Scatter Chart, Chart Elements, Axis, Axis Titles, Chart Title,
6.0 y = 0.0066x + 0.2939 Series1
5.0
Quantity 4.0 Linear (Series1)
2
R = 0.9573
3.0
2.0
1.0
0.0 Linear (Series1)
0 200 400 600 800
Man-hours
FIG. 1.4.1 Install new boiler generating tubes.