Page 33 - Industrial Process Plant Construction Estimating and Man Hour Analysis
P. 33

Introduction to construction statistics using Excel Chapter  1 3
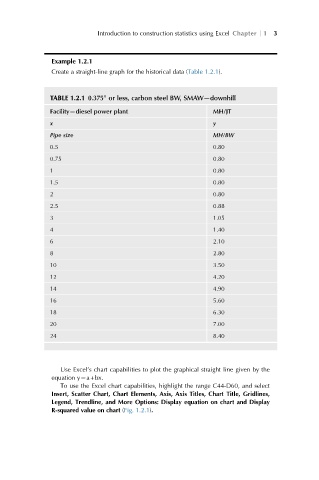


               Example 1.2.1
               Create a straight-line graph for the historical data (Table 1.2.1).


                             00
               TABLE 1.2.1 0.375 or less, carbon steel BW, SMAW—downhill
               Facility—diesel power plant                 MH/JT
               x                                           y
               Pipe size                                   MH/BW
               0.5                                         0.80
               0.75                                        0.80
               1                                           0.80
               1.5                                         0.80
               2                                           0.80
               2.5                                         0.88
               3                                           1.05
               4                                           1.40
               6                                           2.10
               8                                           2.80
               10                                          3.50
               12                                          4.20
               14                                          4.90
               16                                          5.60
               18                                          6.30
               20                                          7.00
               24                                          8.40


                 Use Excel’s chart capabilities to plot the graphical straight line given by the
               equation y¼a+bx.
                 To use the Excel chart capabilities, highlight the range C44-D60, and select
               Insert, Scatter Chart, Chart Elements, Axis, Axis Titles, Chart Title, Gridlines,
               Legend, Trendline, and More Options: Display equation on chart and Display
               R-squared value on chart (Fig. 1.2.1).
   28   29   30   31   32   33   34   35   36   37   38