
Page 133 - Industrial Wastewater Treatment, Recycling and Reuse
P. 133
Advanced Physico-chemical Methods of Treatment for Industrial Wastewaters 107
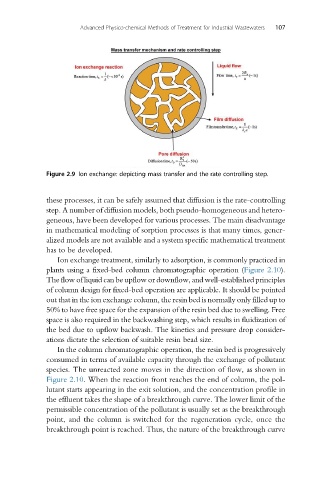
Figure 2.9 Ion exchange: depicting mass transfer and the rate controlling step.
these processes, it can be safely assumed that diffusion is the rate-controlling
step. A number of diffusion models, both pseudo-homogeneous and hetero-
geneous, have been developed for various processes. The main disadvantage
in mathematical modeling of sorption processes is that many times, gener-
alized models are not available and a system specific mathematical treatment
has to be developed.
Ion exchange treatment, similarly to adsorption, is commonly practiced in
plants using a fixed-bed column chromatographic operation (Figure 2.10).
The flow of liquid can be upflow or downflow, and well-established principles
of column design for fixed-bed operation are applicable. It should be pointed
out that in the ion exchange column, the resin bed is normally only filled up to
50% to have free space for the expansion of the resin bed due to swelling. Free
space is also required in the backwashing step, which results in fluidization of
the bed due to upflow backwash. The kinetics and pressure drop consider-
ations dictate the selection of suitable resin bead size.
In the column chromatographic operation, the resin bed is progressively
consumed in terms of available capacity through the exchange of pollutant
species. The unreacted zone moves in the direction of flow, as shown in
Figure 2.10. When the reaction front reaches the end of column, the pol-
lutant starts appearing in the exit solution, and the concentration profile in
the effluent takes the shape of a breakthrough curve. The lower limit of the
permissible concentration of the pollutant is usually set as the breakthrough
point, and the column is switched for the regeneration cycle, once the
breakthrough point is reached. Thus, the nature of the breakthrough curve