
Page 207 - Industrial Wastewater Treatment, Recycling and Reuse
P. 207
Advanced Oxidation Technologies for Wastewater Treatment: An Overview 181
obtained in case of HC alone and the conventional Fenton process (without
3 1
HC)substantiallyincreasedto250.749 10 min whenHCwascombined
with the Fenton process. The inclusion of UV radiation in the process (HC
3 1
+Fenton)canresultintoahigherdegradationrateconstant(297 10 min ),
butitcanbeseenthattheincreaseinthedegradationrateismarginalandalsothe
additional energy costs make this option (HC+Photo-Fenton) less economical
thanacombinedprocessofHCandFenton(asshowninFigure3.14).Inthecase
of the combined process of HC and photocatalysis, the synergetic effect was not
seen. It is observed that the first order reaction rate constant of
2.565 10 3 min 1 and 4.871 10 3 min 1 obtained by applying HC alone
3 1
and photocatalytic process alone increases marginally to 6.837 10 min
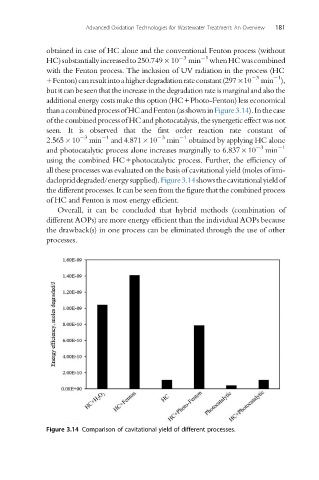
using the combined HC+photocatalytic process. Further, the efficiency of
all these processes was evaluated on the basis of cavitational yield (moles of imi-
daclopriddegraded/energysupplied).Figure3.14showsthecavitationalyieldof
the different processes. It can be seen from the figure that the combined process
of HC and Fenton is most energy efficient.
Overall, it can be concluded that hybrid methods (combination of
different AOPs) are more energy efficient than the individual AOPs because
the drawback(s) in one process can be eliminated through the use of other
processes.
Figure 3.14 Comparison of cavitational yield of different processes.