
Page 324 - Industrial Wastewater Treatment, Recycling and Reuse
P. 324
Urban Wastewater Treatment 297
240
(Capacity in MLD)
210 South
North
180 North–East
North–West
150
120
90
60
30
0
No. of cities Estimated Installed Capacity Sewage Total Planned
sewage sewage gap in cities generation capacity sewage
treatment in cities
capacity
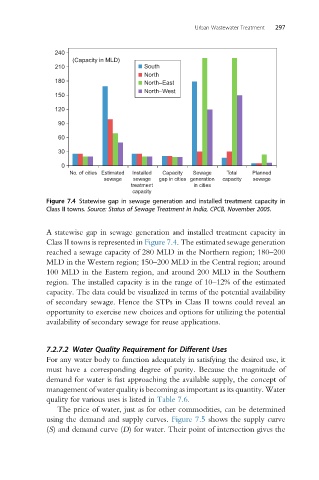
Figure 7.4 Statewise gap in sewage generation and installed treatment capacity in
Class II towns. Source: Status of Sewage Treatment in India, CPCB, November 2005.
A statewise gap in sewage generation and installed treatment capacity in
Class II towns is represented in Figure 7.4. The estimated sewage generation
reached a sewage capacity of 280 MLD in the Northern region; 180–200
MLD in the Western region; 150–200 MLD in the Central region; around
100 MLD in the Eastern region, and around 200 MLD in the Southern
region. The installed capacity is in the range of 10–12% of the estimated
capacity. The data could be visualized in terms of the potential availability
of secondary sewage. Hence the STPs in Class II towns could reveal an
opportunity to exercise new choices and options for utilizing the potential
availability of secondary sewage for reuse applications.
7.2.7.2 Water Quality Requirement for Different Uses
For any water body to function adequately in satisfying the desired use, it
must have a corresponding degree of purity. Because the magnitude of
demand for water is fast approaching the available supply, the concept of
management of water quality is becoming as important as its quantity. Water
quality for various uses is listed in Table 7.6.
The price of water, just as for other commodities, can be determined
using the demand and supply curves. Figure 7.5 shows the supply curve
(S) and demand curve (D) for water. Their point of intersection gives the