Page 328 - Industrial Wastewater Treatment, Recycling and Reuse
P. 328

maintenance
                                                             higher
                                                               for
                                                               (common
                                                             and
                                                                   and
                                                                 7)
                                                             efficiency
                                                                 &
                                                               costs
                                                                   cost
                                                                 6
                                                                 S.No.
                                                                   Higher
                                                                      issue
                                                               land
                                                             Poor
                                                             7.8
                                                      31.6
                                                               23.0
                                                                   4.5
                                                        50.5
                                                                   0.1
                                                               1.2
                                                      2.7
                                                        26.0
                                                             5.6
                                                                             5812.83
                                                        1513.90
                                                             327.53
                                                      158.17
                                                               69.00
                                                                   4.45
       class  cities  I  Average Combined  size  Age  %  capacity  Remarks  (MLD)  capacity  (MLD)  for preference  The  72.8  52.6  3059.63  is  ASP conventional  21.1  1.1  63.36  more  in  realized  8.3  1.0  58.04  others  the  than installations  181.8  3.1  181.84  16.5  0.9  49.50  44.5  0.8  44.50  to  due objection Obvious  13.2  1.1
       of
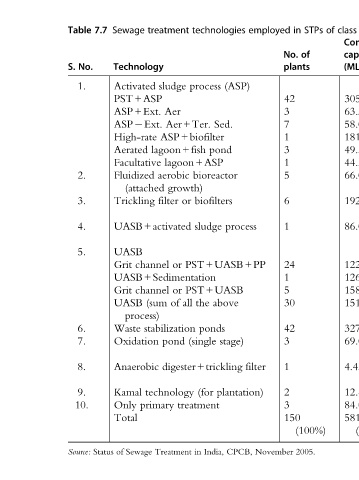
       STPs  of                                                                (100%)  2005.
       in  No.  plants  42  3  7  1  3  1  5  6  1  24  1  5  30  42  3  1  2  3  150
       employed                                                    filter          November
       technologies  (ASP)  process  Sed.  pond  lagoon+ASP  bioreactor  biofilters  process  sludge  PST+UASB+PP  PST+UASB  above  the  ponds  stage)  (single  digester+trickling  plantation)  (for  treatment  CPCB,  India,  in
       treatment  sludge  Aer  Aer+Ter.  ASP+biofilter  lagoon+fish  aerobic  growth)  or  filter  UASB+activated  or  channel UASB+Sedimentation  or channel  all  of  (sum  stabilization  pond  technology  primary  Treatment
       Sewage  Technology  Activated  PST+ASP  ASP+Ext.  ASP Ext.  High-rate  Aerated  Facultative  Fluidized  (attached  Trickling  UASB  Grit  Grit  UASB  process)  Waste  Oxidation  Anaerobic  Kamal  Only  Total  Sewage  of
       7.7                                                                         Status
       Table  No.  S.  1.        2.   3.  4.   5.            6.  7.  8.  9.  10.   Source:
   323   324   325   326   327   328   329   330   331   332   333