
Page 326 - Industrial Wastewater Treatment, Recycling and Reuse
P. 326
Urban Wastewater Treatment 299
High
Demand (D) Supply (S)
S¢ S²
Price
Q
Q¢
Market clearing price (P)
P² P¢
High
Low
Quantity
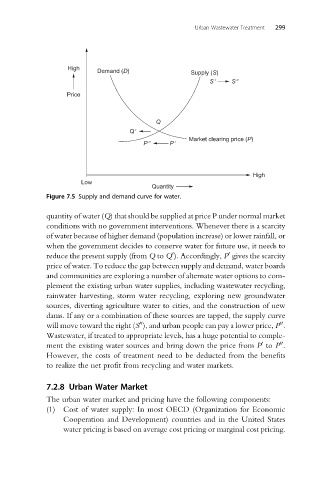
Figure 7.5 Supply and demand curve for water.
quantity of water (Q) that should be supplied at price P under normal market
conditions with no government interventions. Whenever there is a scarcity
of water because of higher demand (population increase) or lower rainfall, or
when the government decides to conserve water for future use, it needs to
0
reduce the present supply (from Q to Q ). Accordingly, P gives the scarcity
0
price of water. To reduce the gap between supply and demand, water boards
and communities are exploring a number of alternate water options to com-
plement the existing urban water supplies, including wastewater recycling,
rainwater harvesting, storm water recycling, exploring new groundwater
sources, diverting agriculture water to cities, and the construction of new
dams. If any or a combination of these sources are tapped, the supply curve
00
00
will move toward the right (S ), and urban people can pay a lower price, P .
Wastewater, if treated to appropriate levels, has a huge potential to comple-
0
ment the existing water sources and bring down the price from P to P .
00
However, the costs of treatment need to be deducted from the benefits
to realize the net profit from recycling and water markets.
7.2.8 Urban Water Market
The urban water market and pricing have the following components:
(1) Cost of water supply: In most OECD (Organization for Economic
Cooperation and Development) countries and in the United States
water pricing is based on average cost pricing or marginal cost pricing.