
Page 363 - Industrial Wastewater Treatment, Recycling and Reuse
P. 363
Phenolic Wastewater Treatment: Development and Applications of New Adsorbent Materials 335
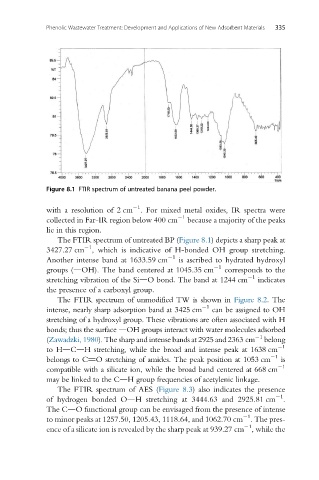
Figure 8.1 FTIR spectrum of untreated banana peel powder.
1
with a resolution of 2 cm . For mixed metal oxides, IR spectra were
collected in Far-IR region below 400 cm 1 because a majority of the peaks
lie in this region.
The FTIR spectrum of untreated BP (Figure 8.1) depicts a sharp peak at
1
3427.27 cm , which is indicative of H-bonded OH group stretching.
1
Another intense band at 1633.59 cm is ascribed to hydrated hydroxyl
groups (dOH). The band centered at 1045.35 cm 1 corresponds to the
1
stretching vibration of the SidO bond. The band at 1244 cm indicates
the presence of a carboxyl group.
The FTIR spectrum of unmodified TW is shown in Figure 8.2.The
intense, nearly sharp adsorption band at 3425 cm 1 can be assigned to OH
stretching of a hydroxyl group. These vibrations are often associated with H
bonds; thus the surface dOH groups interact with water molecules adsorbed
(Zawadzki, 1980). The sharp and intense bands at 2925 and 2363 cm 1 belong
1
to HdCdH stretching, while the broad and intense peak at 1638 cm
belongs to C]O stretching of amides. The peak position at 1053 cm 1 is
1
compatible with a silicate ion, while the broad band centered at 668 cm
maybelinkedtothe CdH group frequencies of acetylenic linkage.
The FTIR spectrum of AES (Figure 8.3) also indicates the presence
1
of hydrogen bonded OdH stretching at 3444.63 and 2925.81 cm .
The CdO functional group can be envisaged from the presence of intense
1
to minor peaks at 1257.50, 1205.43, 1118.64, and 1062.70 cm . The pres-
1
ence of a silicate ion is revealed by the sharp peak at 939.27 cm , while the