
Page 367 - Industrial Wastewater Treatment, Recycling and Reuse
P. 367
Phenolic Wastewater Treatment: Development and Applications of New Adsorbent Materials 339
(a) (b)
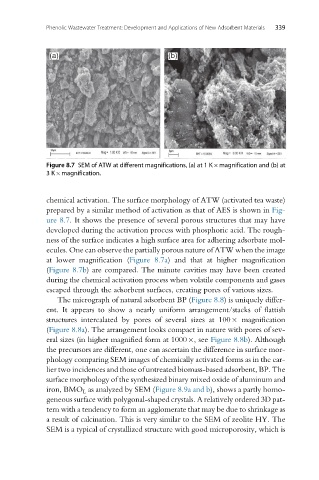
Figure 8.7 SEM of ATW at different magnifications, (a) at 1 K magnification and (b) at
3K magnification.
chemical activation. The surface morphology of ATW (activated tea waste)
prepared by a similar method of activation as that of AES is shown in Fig-
ure 8.7. It shows the presence of several porous structures that may have
developed during the activation process with phosphoric acid. The rough-
ness of the surface indicates a high surface area for adhering adsorbate mol-
ecules. One can observe the partially porous nature of ATW when the image
at lower magnification (Figure 8.7a) and that at higher magnification
(Figure 8.7b) are compared. The minute cavities may have been created
during the chemical activation process when volatile components and gases
escaped through the adsorbent surfaces, creating pores of various sizes.
The micrograph of natural adsorbent BP (Figure 8.8) is uniquely differ-
ent. It appears to show a nearly uniform arrangement/stacks of flattish
structures intercalated by pores of several sizes at 100 magnification
(Figure 8.8a). The arrangement looks compact in nature with pores of sev-
eral sizes (in higher magnified form at 1000 , see Figure 8.8b). Although
the precursors are different, one can ascertain the difference in surface mor-
phology comparing SEM images of chemically activated forms as in the ear-
lier two incidences and those of untreated biomass-based adsorbent, BP. The
surface morphology of the synthesized binary mixed oxide of aluminum and
iron, BMO L as analyzed by SEM (Figure 8.9a and b), shows a partly homo-
geneous surface with polygonal-shaped crystals. A relatively ordered 3D pat-
tern with a tendency to form an agglomerate that may be due to shrinkage as
a result of calcination. This is very similar to the SEM of zeolite HY. The
SEM is a typical of crystallized structure with good microporosity, which is