
Page 371 - Industrial Wastewater Treatment, Recycling and Reuse
P. 371
Phenolic Wastewater Treatment: Development and Applications of New Adsorbent Materials 343
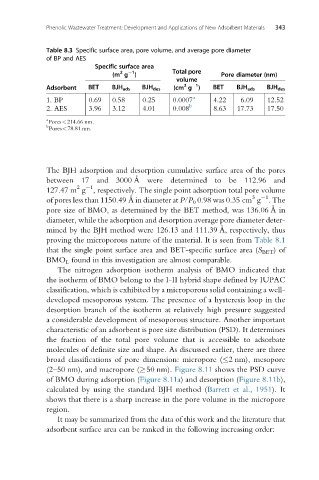
Table 8.3 Specific surface area, pore volume, and average pore diameter
of BP and AES
Specific surface area
1
2
(m g ) Total pore Pore diameter (nm)
volume
1
3
Adsorbent BET BJH ads BJH des (cm g ) BET BJH ads BJH des
1. BP 0.69 0.58 0.25 0.0007 a 4.22 6.09 12.52
2. AES 3.96 3.12 4.01 0.008 b 8.63 17.73 17.50
a
Pores<214.66 nm.
b
Pores<78.81 nm.
The BJH adsorption and desorption cumulative surface area of the pores
˚
between 17 and 3000 A were determined to be 112.96 and
2 1
127.47 m g , respectively. The single point adsorption total pore volume
˚
3
1
of pores less than 1150.49 A in diameter at P/P 0 0.98 was 0.35 cm g . The
˚
pore size of BMO, as determined by the BET method, was 136.06 A in
diameter, while the adsorption and desorption average pore diameter deter-
˚
mined by the BJH method were 126.13 and 111.39 A, respectively, thus
proving the microporous nature of the material. It is seen from Table 8.1
that the single point surface area and BET-specific surface area (S BET )of
BMO L found in this investigation are almost comparable.
The nitrogen adsorption isotherm analysis of BMO indicated that
the isotherm of BMO belong to the I-II hybrid shape defined by IUPAC
classification, which is exhibited by a microporous solid containing a well-
developed mesoporous system. The presence of a hysteresis loop in the
desorption branch of the isotherm at relatively high pressure suggested
a considerable development of mesoporous structure. Another important
characteristic of an adsorbent is pore size distribution (PSD). It determines
the fraction of the total pore volume that is accessible to adsorbate
molecules of definite size and shape. As discussed earlier, there are three
broad classifications of pore dimension: micropore ( 2 nm), mesopore
(2–50 nm), and macropore ( 50 nm). Figure 8.11 shows the PSD curve
of BMO during adsorption (Figure 8.11a) and desorption (Figure 8.11b),
calculated by using the standard BJH method (Barrettetal.,1951). It
shows that there is a sharp increase in the pore volume in the micropore
region.
It may be summarized from the data of this work and the literature that
adsorbent surface area can be ranked in the following increasing order: