
Page 366 - Industrial Wastewater Treatment, Recycling and Reuse
P. 366
338 Industrial Wastewater Treatment, Recycling, and Reuse
The major IR bands for BMO L are recorded at 385, 360, 341.37, 327.87,
1 1
318.23, and 287.37 cm . The bands at 318.23, 360, and 385 cm are
attributed to a-Fe 2 O 3 . The peaks above and around 250 cm 1 also represent
1
vibrations arising out of AldO bond. Peaks below 250 cm are due to the
distortion of the hematite network due to introduction of Al atoms.
8.3.2 Scanning Electron Micrography
SEM is one of the most widely used diagnostic tools. It helps to reveal whether
the surface of the adsorbent is heterogeneous or homogeneous and the degree
of porosity of the adsorbent for entrapment of the adsorbate. The large depth
of field of 30 mm provided by SEM allows a large amount of sample to be
studied at a time, resulting in a three-dimensional image representation of
the sample. The magnification in SEM is of the range 10 500 K , and this
property of greater magnification, larger depth of field, and higher resolution
coupled with information on composition and crystallography delivers SEM
as one of the highly used instruments in morphological analysis. SEM is there-
fore a primary tool for characterizing the surface morphology and fundamental
physical properties of various adsorbents.
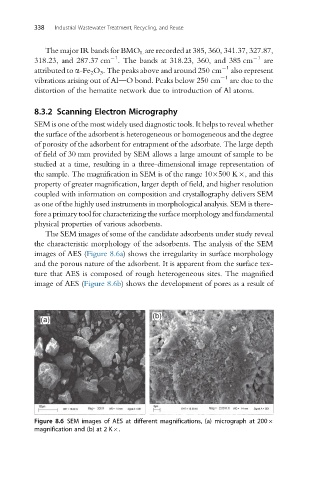
The SEM images of some of the candidate adsorbents under study reveal
the characteristic morphology of the adsorbents. The analysis of the SEM
images of AES (Figure 8.6a) shows the irregularity in surface morphology
and the porous nature of the adsorbent. It is apparent from the surface tex-
ture that AES is composed of rough heterogeneous sites. The magnified
image of AES (Figure 8.6b) shows the development of pores as a result of
(b)
(a)
Figure 8.6 SEM images of AES at different magnifications, (a) micrograph at 200
magnification and (b) at 2 K .