
Page 369 - Industrial Wastewater Treatment, Recycling and Reuse
P. 369
Phenolic Wastewater Treatment: Development and Applications of New Adsorbent Materials 341
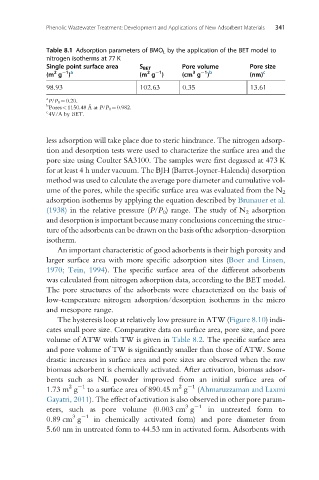
Table 8.1 Adsorption parameters of BMO L by the application of the BET model to
nitrogen isotherms at 77 K
Single point surface area S BET Pore volume Pore size
1 b
1
2
2
1 a
3
(m g ) (m g ) (cm g ) (nm) c
98.93 102.63 0.35 13.61
a
P/P 0 ¼0.20.
b ˚
Pores<1150.48 A at P/P 0 ¼0.982.
c
4V/A by BET.
less adsorption will take place due to steric hindrance. The nitrogen adsorp-
tion and desorption tests were used to characterize the surface area and the
pore size using Coulter SA3100. The samples were first degassed at 473 K
for at least 4 h under vacuum. The BJH (Barret-Joyner-Halenda) desorption
method was used to calculate the average pore diameter and cumulative vol-
ume of the pores, while the specific surface area was evaluated from the N 2
adsorption isotherms by applying the equation described by Brunauer et al.
(1938) in the relative pressure (P/P 0 ) range. The study of N 2 adsorption
and desorption is important because many conclusions concerning the struc-
ture of the adsorbents can be drawn on the basis of the adsorption-desorption
isotherm.
An important characteristic of good adsorbents is their high porosity and
larger surface area with more specific adsorption sites (Boer and Linsen,
1970; Tein, 1994). The specific surface area of the different adsorbents
was calculated from nitrogen adsorption data, according to the BET model.
The pore structures of the adsorbents were characterized on the basis of
low-temperature nitrogen adsorption/desorption isotherms in the micro
and mesopore range.
The hysteresis loop at relatively low pressure in ATW (Figure 8.10) indi-
cates small pore size. Comparative data on surface area, pore size, and pore
volume of ATW with TW is given in Table 8.2. The specific surface area
and pore volume of TW is significantly smaller than those of ATW. Some
drastic increases in surface area and pore sizes are observed when the raw
biomass adsorbent is chemically activated. After activation, biomass adsor-
bents such as NL powder improved from an initial surface area of
2 1 2 1
1.73 m g to a surface area of 890.45 m g (Ahmaruzzaman and Laxmi
Gayatri, 2011). The effect of activation is also observed in other pore param-
3 1
eters, such as pore volume (0.003 cm g in untreated form to
3
0.89 cm g 1 in chemically activated form) and pore diameter from
5.60 nm in untreated form to 44.53 nm in activated form. Adsorbents with