
Page 459 - Industrial Wastewater Treatment, Recycling and Reuse
P. 459
Application of Anaerobic Membrane Bioreactor 429
during the investigation was 7719 mg/L. The ratio of average VSS to aver-
age TSS in the bioreactor was 0.73, and it was almost constant throughout
the study.
10.4.3.2.4 Membrane Filtration Performance
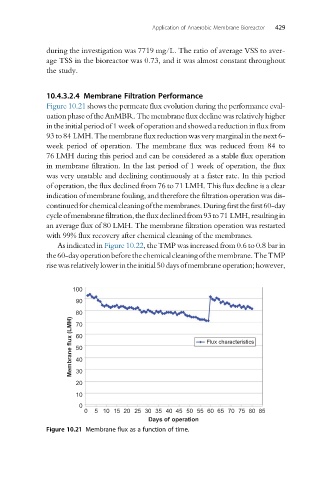
Figure 10.21 shows the permeate flux evolution during the performance eval-
uationphaseof the AnMBR. The membraneflux declinewas relatively higher
in the initial periodof 1 week of operationand showeda reduction in fluxfrom
93to84 LMH. The membrane flux reductionwas very marginal in the next 6-
week period of operation. The membrane flux was reduced from 84 to
76 LMH during this period and can be considered as a stable flux operation
in membrane filtration. In the last period of 1 week of operation, the flux
was very unstable and declining continuously at a faster rate. In this period
of operation, the flux declined from 76 to 71 LMH. This flux decline is a clear
indication of membrane fouling, and therefore the filtration operation was dis-
continuedforchemicalcleaningofthemembranes.Duringfirstthefirst60-day
cycleofmembranefiltration,thefluxdeclinedfrom93to71 LMH,resultingin
an average flux of 80 LMH. The membrane filtration operation was restarted
with 99% flux recovery after chemical cleaning of the membranes.
As indicated in Figure 10.22, the TMP was increased from 0.6 to 0.8 bar in
the60-dayoperationbeforethechemicalcleaningofthemembrane.TheTMP
risewasrelativelylowerintheinitial50daysofmembraneoperation;however,
100
90
80
Membrane flux (LMH) 60 Flux characteristics
70
50
40
30
20
10
0
0 510 15 20 25 30 35 40 45 50 55 60 65 70 75 80 85
Days of operation
Figure 10.21 Membrane flux as a function of time.