
Page 457 - Industrial Wastewater Treatment, Recycling and Reuse
P. 457
Application of Anaerobic Membrane Bioreactor 427
300 0.60
250 0.50
Biogas generated (L/day) 150 Biogas generated 0.30 Biogas yield (m 3 /kg COD removed)
0.40
200
Biogas yield
0.20
100
50 0.10
0 0.00
0 5 10 15 20 25 30 35 40 45 50 55 60 65 70 75 80 85
Days of operation
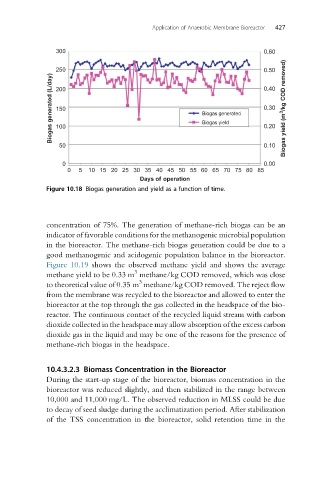
Figure 10.18 Biogas generation and yield as a function of time.
concentration of 75%. The generation of methane-rich biogas can be an
indicator of favorable conditions for the methanogenic microbial population
in the bioreactor. The methane-rich biogas generation could be due to a
good methanogenic and acidogenic population balance in the bioreactor.
Figure 10.19 shows the observed methane yield and shows the average
3
methane yield to be 0.33 m methane/kg COD removed, which was close
3
to theoretical value of 0.35 m methane/kg COD removed. The reject flow
from the membrane was recycled to the bioreactor and allowed to enter the
bioreactor at the top through the gas collected in the headspace of the bio-
reactor. The continuous contact of the recycled liquid stream with carbon
dioxide collected in the headspace may allow absorption of the excess carbon
dioxide gas in the liquid and may be one of the reasons for the presence of
methane-rich biogas in the headspace.
10.4.3.2.3 Biomass Concentration in the Bioreactor
During the start-up stage of the bioreactor, biomass concentration in the
bioreactor was reduced slightly, and then stabilized in the range between
10,000 and 11,000 mg/L. The observed reduction in MLSS could be due
to decay of seed sludge during the acclimatization period. After stabilization
of the TSS concentration in the bioreactor, solid retention time in the