
Page 453 - Industrial Wastewater Treatment, Recycling and Reuse
P. 453
424 Industrial Wastewater Treatment, Recycling, and Reuse
800
Feed COD
700 Bioreactor COD
Permeate COD
600
500
COD (mg/L) 400
300
200
100
0
0 5 10 15 20 25 30 35 40 45 50 55 60 65 70 75 80 85
Days of operation
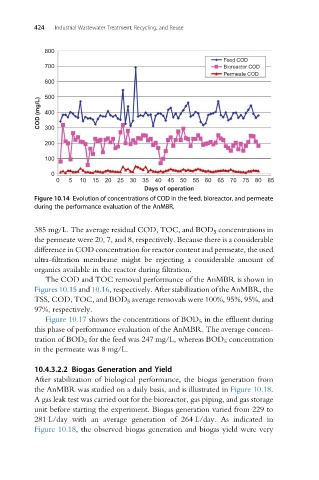
Figure 10.14 Evolution of concentrations of COD in the feed, bioreactor, and permeate
during the performance evaluation of the AnMBR.
385 mg/L. The average residual COD, TOC, and BOD 5 concentrations in
the permeate were 20, 7, and 8, respectively. Because there is a considerable
difference in COD concentration for reactor content and permeate, the used
ultra-filtration membrane might be rejecting a considerable amount of
organics available in the reactor during filtration.
The COD and TOC removal performance of the AnMBR is shown in
Figures 10.15 and 10.16, respectively. After stabilization of the AnMBR, the
TSS, COD, TOC, and BOD 5 average removals were 100%, 95%, 95%, and
97%, respectively.
Figure 10.17 shows the concentrations of BOD 5 in the effluent during
this phase of performance evaluation of the AnMBR. The average concen-
tration of BOD 5 for the feed was 247 mg/L, whereas BOD 5 concentration
in the permeate was 8 mg/L.
10.4.3.2.2 Biogas Generation and Yield
After stabilization of biological performance, the biogas generation from
the AnMBR was studied on a daily basis, and is illustrated in Figure 10.18.
A gas leak test was carried out for the bioreactor, gas piping, and gas storage
unit before starting the experiment. Biogas generation varied from 229 to
281 L/day with an average generation of 264 L/day. As indicated in
Figure 10.18, the observed biogas generation and biogas yield were very