
Page 448 - Industrial Wastewater Treatment, Recycling and Reuse
P. 448
Application of Anaerobic Membrane Bioreactor 419
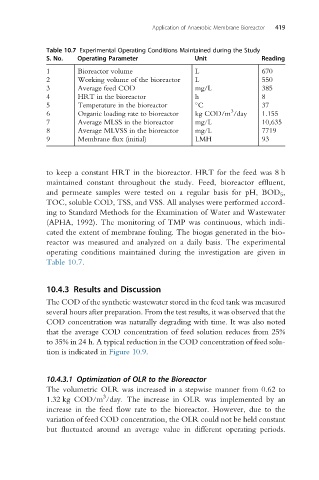
Table 10.7 Experimental Operating Conditions Maintained during the Study
S. No. Operating Parameter Unit Reading
1 Bioreactor volume L 670
2 Working volume of the bioreactor L 550
3 Average feed COD mg/L 385
4 HRT in the bioreactor h 8
5 Temperature in the bioreactor C 37
3
6 Organic loading rate to bioreactor kg COD/m /day 1.155
7 Average MLSS in the bioreactor mg/L 10,635
8 Average MLVSS in the bioreactor mg/L 7719
9 Membrane flux (initial) LMH 93
to keep a constant HRT in the bioreactor. HRT for the feed was 8 h
maintained constant throughout the study. Feed, bioreactor effluent,
and permeate samples were tested on a regular basis for pH, BOD 5 ,
TOC, soluble COD, TSS, and VSS. All analyses were performed accord-
ing to Standard Methods for the Examination of Water and Wastewater
(APHA, 1992). The monitoring of TMP was continuous, which indi-
cated the extent of membrane fouling. The biogas generated in the bio-
reactor was measured and analyzed on a daily basis. The experimental
operating conditions maintained during the investigation are given in
Table 10.7.
10.4.3 Results and Discussion
The COD of the synthetic wastewater stored in the feed tank was measured
several hours after preparation. From the test results, it was observed that the
COD concentration was naturally degrading with time. It was also noted
that the average COD concentration of feed solution reduces from 25%
to 35% in 24 h. A typical reduction in the COD concentration of feed solu-
tion is indicated in Figure 10.9.
10.4.3.1 Optimization of OLR to the Bioreactor
The volumetric OLR was increased in a stepwise manner from 0.62 to
3
1.32 kg COD/m /day. The increase in OLR was implemented by an
increase in the feed flow rate to the bioreactor. However, due to the
variation of feed COD concentration, the OLR could not be held constant
but fluctuated around an average value in different operating periods.