
Page 452 - Industrial Wastewater Treatment, Recycling and Reuse
P. 452
Application of Anaerobic Membrane Bioreactor 423
350 0.49
0.48
300 0.47
Biogas generated (liters/day) 200 0.45 Biogas yield (m 3 /kg COD removed)
250
0.46
0.44
150
0.43
100
0.41
50 0.42
0.4
0 0.39
0.62 0.77 0.92 1.32
3
OLR (kg COD/m /day)
Biogas yield Biogas generated
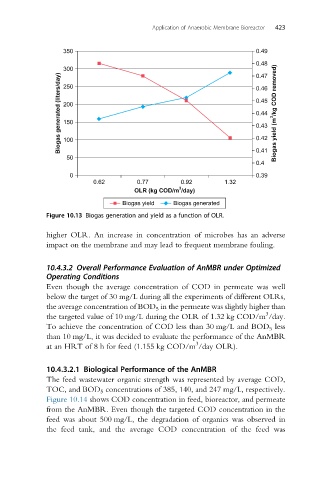
Figure 10.13 Biogas generation and yield as a function of OLR.
higher OLR. An increase in concentration of microbes has an adverse
impact on the membrane and may lead to frequent membrane fouling.
10.4.3.2 Overall Performance Evaluation of AnMBR under Optimized
Operating Conditions
Even though the average concentration of COD in permeate was well
below the target of 30 mg/L during all the experiments of different OLRs,
the average concentration of BOD 5 in the permeate was slightly higher than
3
the targeted value of 10 mg/L during the OLR of 1.32 kg COD/m /day.
To achieve the concentration of COD less than 30 mg/L and BOD 5 less
than 10 mg/L, it was decided to evaluate the performance of the AnMBR
3
at an HRT of 8 h for feed (1.155 kg COD/m /day OLR).
10.4.3.2.1 Biological Performance of the AnMBR
The feed wastewater organic strength was represented by average COD,
TOC, and BOD 5 concentrations of 385, 140, and 247 mg/L, respectively.
Figure 10.14 shows COD concentration in feed, bioreactor, and permeate
from the AnMBR. Even though the targeted COD concentration in the
feed was about 500 mg/L, the degradation of organics was observed in
the feed tank, and the average COD concentration of the feed was