
Page 514 - Industrial Wastewater Treatment, Recycling and Reuse
P. 514
484 Industrial Wastewater Treatment, Recycling, and Reuse
models of the individual units. The ability to include alternative operating
strategies, bypassing entire sequences of operations and mimicking hierar-
chical control strategies in an Aspen model, enabled development of and
simulations with very realistic process models.
12.3.5 Water Optimization in the Bayer Process: Water
Integration
Deng and Feng (2009) analyzed the water system of an entire alumina plant
using the methods of pinch technology and obtained optimal water regen-
eration flow rates and contaminant concentrations targets. Based on these,
they designed a water-using network that would achieve zero waste dis-
charge, resulting in a freshwater saving rate of 62.7%.
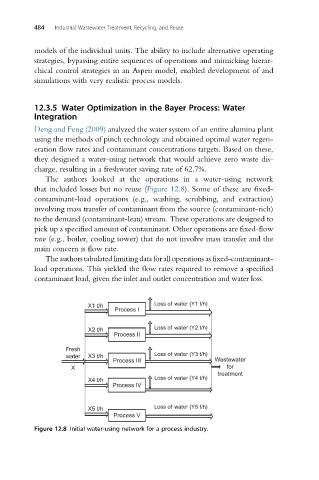
The authors looked at the operations in a water-using network
that included losses but no reuse (Figure 12.8). Some of these are fixed-
contaminant-load operations (e.g., washing, scrubbing, and extraction)
involving mass transfer of contaminant from the source (contaminant-rich)
to the demand (contaminant-lean) stream. These operations are designed to
pick up a specified amount of contaminant. Other operations are fixed-flow
rate (e.g., boiler, cooling tower) that do not involve mass transfer and the
main concern is flow rate.
The authors tabulatedlimiting data for all operations as fixed-contaminant-
load operations. This yielded the flow rates required to remove a specified
contaminant load, given the inlet and outlet concentration and water loss.
Loss of water (Y1 t/h)
X1 t/h
Process I
X2 t/h Loss of water (Y2 t/h)
Process II
Fresh
Loss of water (Y3 t/h)
water X3 t/h
Process III Wastewater
X for
treatment
X4 t/h Loss of water (Y4 t/h)
Process IV
X5 t/h Loss of water (Y5 t/h)
Process V
Figure 12.8 Initial water-using network for a process industry.