
Page 515 - Industrial Wastewater Treatment, Recycling and Reuse
P. 515
Simulation, Control, and Optimization of Water Systems in Industrial Plants 485
This was transposed into limiting data for the demands (inlet streams to
the water using operations) and sources (outlet streams from the water using
operations, i.e., those that could potentially be reused downstream, or
recycled).
Using a method called the composite table algorithm, the authors con-
structed the composite curves for the system and calculated the optimum
regeneration flow and concentration.
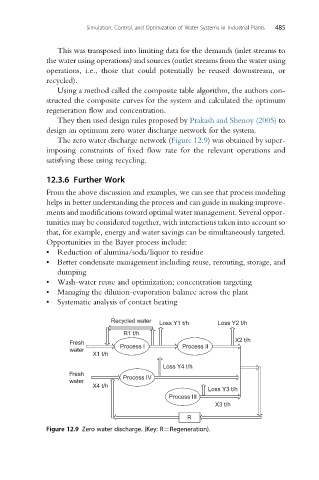
They then used design rules proposed by Prakash and Shenoy (2005) to
design an optimum zero water discharge network for the system.
The zero water discharge network (Figure 12.9) was obtained by super-
imposing constraints of fixed flow rate for the relevant operations and
satisfying these using recycling.
12.3.6 Further Work
From the above discussion and examples, we can see that process modeling
helps in better understanding the process and can guide in making improve-
ments and modifications toward optimal water management. Several oppor-
tunities may be considered together, with interactions taken into account so
that, for example, energy and water savings can be simultaneously targeted.
Opportunities in the Bayer process include:
• Reduction of alumina/soda/liquor to residue
• Better condensate management including reuse, rerouting, storage, and
dumping
• Wash-water reuse and optimization; concentration targeting
• Managing the dilution-evaporation balance across the plant
• Systematic analysis of contact heating
Recycled water Loss Y1 t/h Loss Y2 t/h
R1 t/h
Fresh X2 t/h
Process I Process II
water
X1 t/h
Loss Y4 t/h
Fresh Process IV
water
X4 t/h
Loss Y3 t/h
Process III
X3 t/h
R
Figure 12.9 Zero water discharge. (Key: R¼Regeneration).