
Page 126 - Injection Molding Advanced Troubleshooting Guide
P. 126
13.1 Cavity Pressure Technology 113
Plastic fill rate
Cavity balance
Viscosity shift in material
Gate seal
Pack rate
Pressure drop across the cavity
Cooling rate
Mold or clamp deflection
Valve gate actuation
Process changes
Machine performance
All of the above data is collected on every shot and can be set up with alarm bands
to determine if the part is good or bad while it is still in the mold.
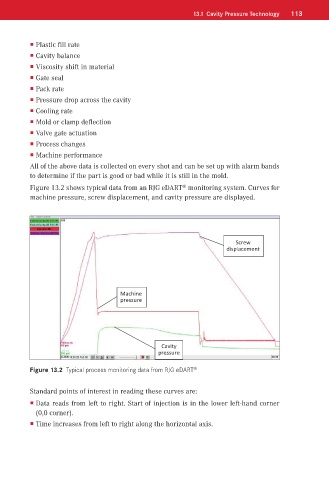
Figure 13.2 shows typical data from an RJG eDART monitoring system. Curves for
®
machine pressure, screw displacement, and cavity pressure are displayed.
Screw
displacement
Machine
pressure
Cavity
pressure
Figure 13.2 Typical process monitoring data from RJG eDART ®
Standard points of interest in reading these curves are:
Data reads from left to right. Start of injection is in the lower left-hand corner
(0,0 corner).
Time increases from left to right along the horizontal axis.