
Page 128 - Injection Molding Advanced Troubleshooting Guide
P. 128
13.1 Cavity Pressure Technology 115
Machine
pressure
Screw
displacement
Post gate
cavity
pressure
curves (2)
End of cavity
pressure
curve
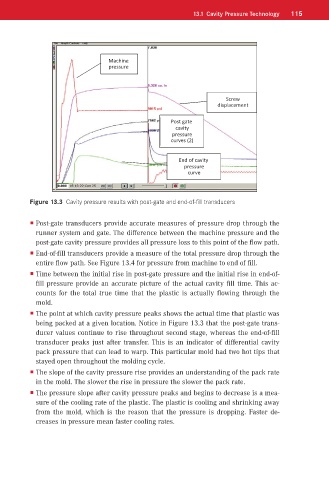
Figure 13.3 Cavity pressure results with post-gate and end-of-fill transducers
Post-gate transducers provide accurate measures of pressure drop through the
runner system and gate. The difference between the machine pressure and the
post-gate cavity pressure provides all pressure loss to this point of the flow path.
End-of-fill transducers provide a measure of the total pressure drop through the
entire flow path. See Figure 13.4 for pressure from machine to end of fill.
Time between the initial rise in post-gate pressure and the initial rise in end-of-
fill pressure provide an accurate picture of the actual cavity fill time. This ac-
counts for the total true time that the plastic is actually flowing through the
mold.
The point at which cavity pressure peaks shows the actual time that plastic was
being packed at a given location. Notice in Figure 13.3 that the post-gate trans-
ducer values continue to rise throughout second stage, whereas the end-of-fill
transducer peaks just after transfer. This is an indicator of differential cavity
pack pressure that can lead to warp. This particular mold had two hot tips that
stayed open throughout the molding cycle.
The slope of the cavity pressure rise provides an understanding of the pack rate
in the mold. The slower the rise in pressure the slower the pack rate.
The pressure slope after cavity pressure peaks and begins to decrease is a mea-
sure of the cooling rate of the plastic. The plastic is cooling and shrinking away
from the mold, which is the reason that the pressure is dropping. Faster de-
creases in pressure mean faster cooling rates.