
Page 83 - Injection Molding Advanced Troubleshooting Guide
P. 83
8.3 Velocity Linearity 67
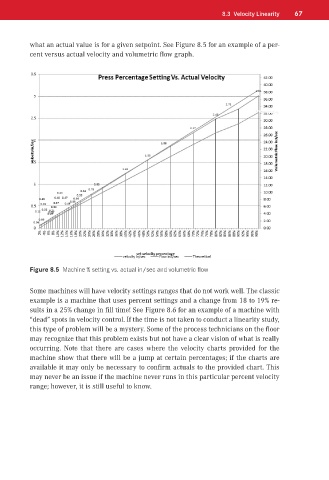
what an actual value is for a given setpoint. See Figure 8.5 for an example of a per-
cent versus actual velocity and volumetric flow graph.
Figure 8.5 Machine % setting vs. actual in/sec and volumetric flow
Some machines will have velocity settings ranges that do not work well. The classic
example is a machine that uses percent settings and a change from 18 to 19% re-
sults in a 25% change in fill time! See Figure 8.6 for an example of a machine with
“dead” spots in velocity control. If the time is not taken to conduct a linearity study,
this type of problem will be a mystery. Some of the process technicians on the floor
may recognize that this problem exists but not have a clear vision of what is really
occurring. Note that there are cases where the velocity charts provided for the
machine show that there will be a jump at certain percentages; if the charts are
available it may only be necessary to confirm actuals to the provided chart. This
may never be an issue if the machine never runs in this particular percent velocity
range; however, it is still useful to know.