
Page 84 - Injection Molding Advanced Troubleshooting Guide
P. 84
68 8 Machine Performance
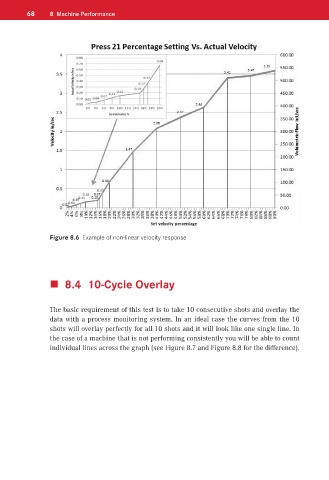
Figure 8.6 Example of non-linear velocity response
8.4 10-Cycle Overlay
The basic requirement of this test is to take 10 consecutive shots and overlay the
data with a process monitoring system. In an ideal case the curves from the 10
shots will overlay perfectly for all 10 shots and it will look like one single line. In
the case of a machine that is not performing consistently you will be able to count
individual lines across the graph (see Figure 8.7 and Figure 8.8 for the difference).