
Page 82 - Innovations in Intelligent Machines
P. 82
Team, Game, and Negotiation based UAV Task Allocation 71
on the horizontal axis. These plots reveal important information about the
computational effort that each strategy demands.
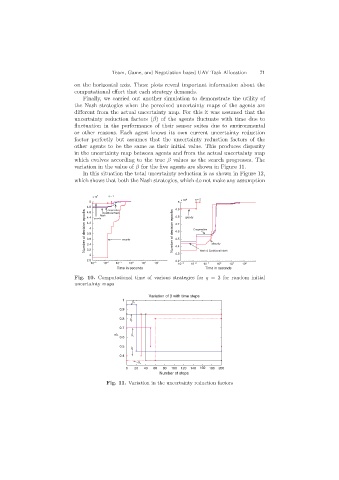
Finally, we carried out another simulation to demonstrate the utility of
the Nash strategies when the perceived uncertainty maps of the agents are
different from the actual uncertainty map. For this it was assumed that the
uncertainty reduction factors (β) of the agents fluctuate with time due to
fluctuation in the performance of their sensor suites due to environmental
or other reasons. Each agent knows its own current uncertainty reduction
factor perfectly but assumes that the uncertainty reduction factors of the
other agents to be the same as their initial value. This produces disparity
in the uncertainty map between agents and from the actual uncertainty map
which evolves according to the true β values as the search progresses. The
variation in the value of β for the five agents are shown in Figure 11.
In this situation the total uncertainty reduction is as shown in Figure 12,
which shows that both the Nash strategies, which do not make any assumption
4 q = 1
x 10
x 10 4 q = 2
5 5
4.8 greedy Nash Coalitional Nash 4.9 greedy
Number of decision epochs 4.2 4 security Number of decision epochs 4.7 Cooperative
cooperative
4.6
4.8
4.4
4.6
3.8
3.6
4.5
security
3.4
3.2
4.3
3 4.4 Nash & Coalitional Nash
2.8 4.2
10 -3 10 -2 10 -1 10 0 10 1 10 2 10 -3 10 -2 10 -1 10 0 10 1 10 2
Time in seconds Time in seconds
Fig. 10. Computational time of various strategies for q = 2 for random initial
uncertainty maps
Variation of β with time steps
1
β 1
0.9
0.8
β 2
0.7
β β 3
0.6
0.5
β 4
0.4
β 5
0 20 40 60 80 100 120 140 160 180 200
Number of steps
Fig. 11. Variation in the uncertainty reduction factors