
Page 119 - Instant notes
P. 119
Phase equilibria 105
and temperature. For water, the melting point line is of negative gradient, which produces
the plot shown in Fig. 1b.
These plots are known as phase diagrams. Solid, liquid and gas are each a different
phase (see Topic D5) and so these diagrams allow prediction of the nature of the phase(s)
present for any condition of p and T (any state point on the diagram). In fact, p and T,
which are both intensive variables (see Topic B1) are all that is required to specify the
state of the system (its molecular disposition or the number and amount of the phases
present and their composition, see Topic D5). This is because although the pressure, p,
the molar volume, V m, and the temperature, T, are the three intensive variables used to
define the state of a single substance system, these are linked by an equation of state (for
example pV m=RT for a perfect gas, see Topic A1) and knowledge of only two of these
variables is necessary, as the equation of state can be used to calculate the third and
specify the state. As a consequence, any two of these three variables can be used as the
axes of a single substance phase diagram. In all cases, the solid phase is favoured at low
volumes and temperatures and high pressures, the gas (or vapor) is favored at high
temperatures and volumes and low pressures and the liquid is favored at intermediate
conditions, which simplifies phase diagram labeling.
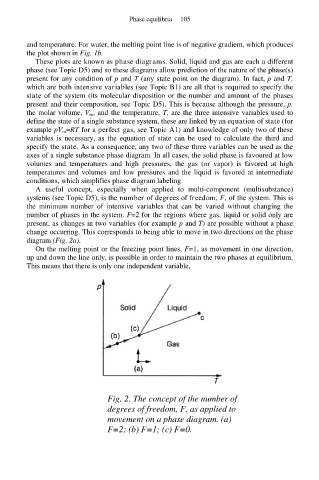
A useful concept, especially when applied to multi-component (multisubstance)
systems (see Topic D5), is the number of degrees of freedom, F, of the system. This is
the minimum number of intensive variables that can be varied without changing the
number of phases in the system. F=2 for the regions where gas, liquid or solid only are
present, as changes in two variables (for example p and T) are possible without a phase
change occurring. This corresponds to being able to move in two directions on the phase
diagram (Fig. 2a).
On the melting point or the freezing point lines, F=1, as movement in one direction,
up and down the line only, is possible in order to maintain the two phases at equilibrium.
This means that there is only one independent variable,
Fig. 2. The concept of the number of
degrees of freedom, F, as applied to
movement on a phase diagram. (a)
F=2; (b) F=1; (c) F=0.