
Page 124 - Instant notes
P. 124
Physical chemistry 110
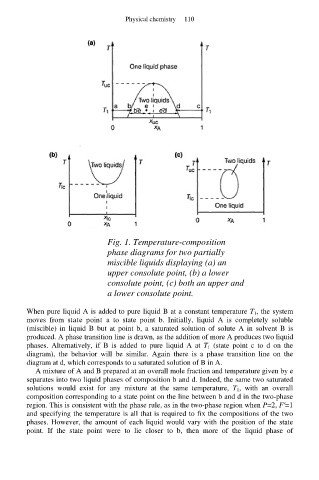
Fig. 1. Temperature-composition
phase diagrams for two partially
miscible liquids displaying (a) an
upper consolute point, (b) a lower
consolute point, (c) both an upper and
a lower consolute point.
When pure liquid A is added to pure liquid B at a constant temperature T 1, the system
moves from state point a to state point b. Initially, liquid A is completely soluble
(miscible) in liquid B but at point b, a saturated solution of solute A in solvent B is
produced. A phase transition line is drawn, as the addition of more A produces two liquid
phases. Alternatively, if B is added to pure liquid A at T 1 (state point c to d on the
diagram), the behavior will be similar. Again there is a phase transition line on the
diagram at d, which corresponds to a saturated solution of B in A.
A mixture of A and B prepared at an overall mole fraction and temperature given by e
separates into two liquid phases of composition b and d. Indeed, the same two saturated
solutions would exist for any mixture at the same temperature, T 1, with an overall
composition corresponding to a state point on the line between b and d in the two-phase
region. This is consistent with the phase rule, as in the two-phase region when P=2, F′=1
and specifying the temperature is all that is required to fix the compositions of the two
phases. However, the amount of each liquid would vary with the position of the state
point. If the state point were to lie closer to b, then more of the liquid phase of